Fig. 9.
Download original image
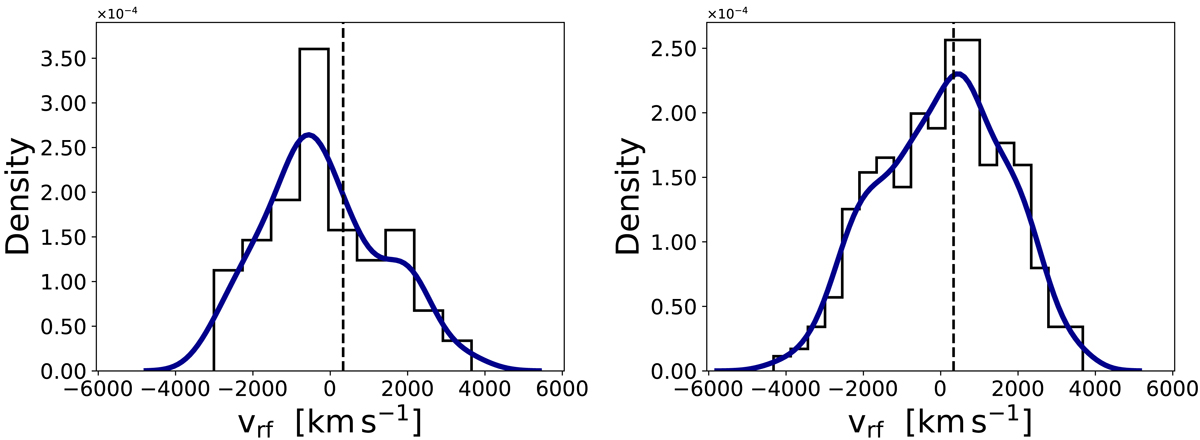
Rest-frame velocity distribution relative to the mean cluster velocity of the 120 galaxies having R < 20 (left panel), and of the 395 galaxies within 1 Mpc from the cluster centre (right panel). The smooth curve is the probability density function obtained with a kernel density estimator. In both panels, the dashed line indicates the rest-frame velocity of the BCG: (VBCG − ⟨V⟩)/(1 + z) = 333 km s−1.
Current usage metrics show cumulative count of Article Views (full-text article views including HTML views, PDF and ePub downloads, according to the available data) and Abstracts Views on Vision4Press platform.
Data correspond to usage on the plateform after 2015. The current usage metrics is available 48-96 hours after online publication and is updated daily on week days.
Initial download of the metrics may take a while.