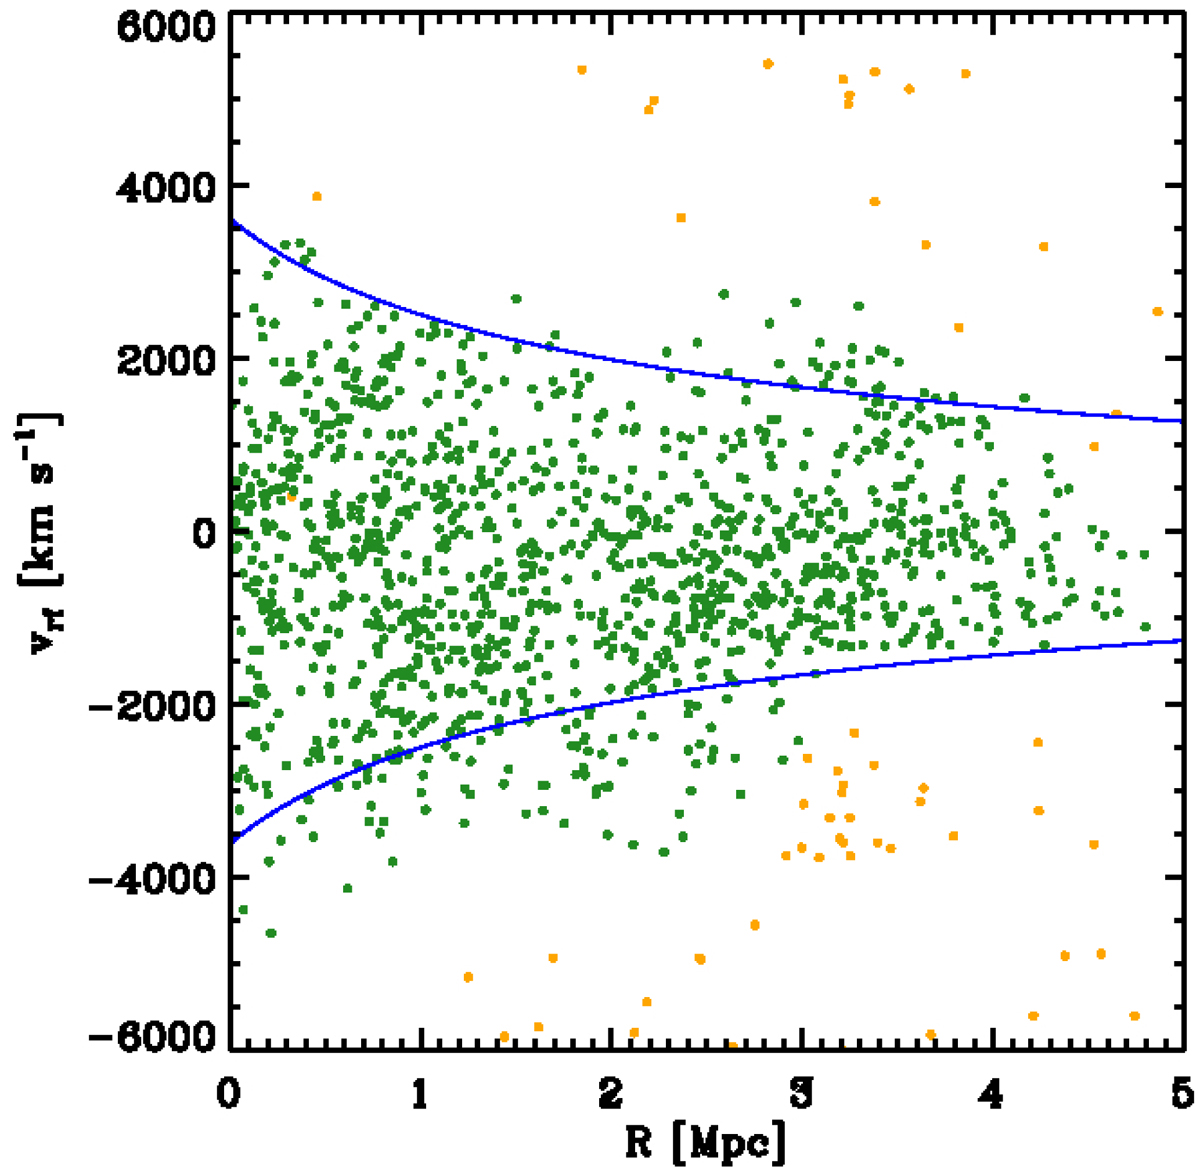
Fig. 8.
Download original image
Phase-space diagram including 1305 galaxies from the spectroscopic sample, where rest-frame velocities are plotted vs. the clustercentric distance. Green circles highlight the 1234 cluster members. Yellow circles indicate galaxies that lie in the selected cluster redshift range, but are rejected in the second step of our member selection procedure. The escape velocity curves are also shown (blue lines).
Current usage metrics show cumulative count of Article Views (full-text article views including HTML views, PDF and ePub downloads, according to the available data) and Abstracts Views on Vision4Press platform.
Data correspond to usage on the plateform after 2015. The current usage metrics is available 48-96 hours after online publication and is updated daily on week days.
Initial download of the metrics may take a while.