Free Access
Fig. 4.
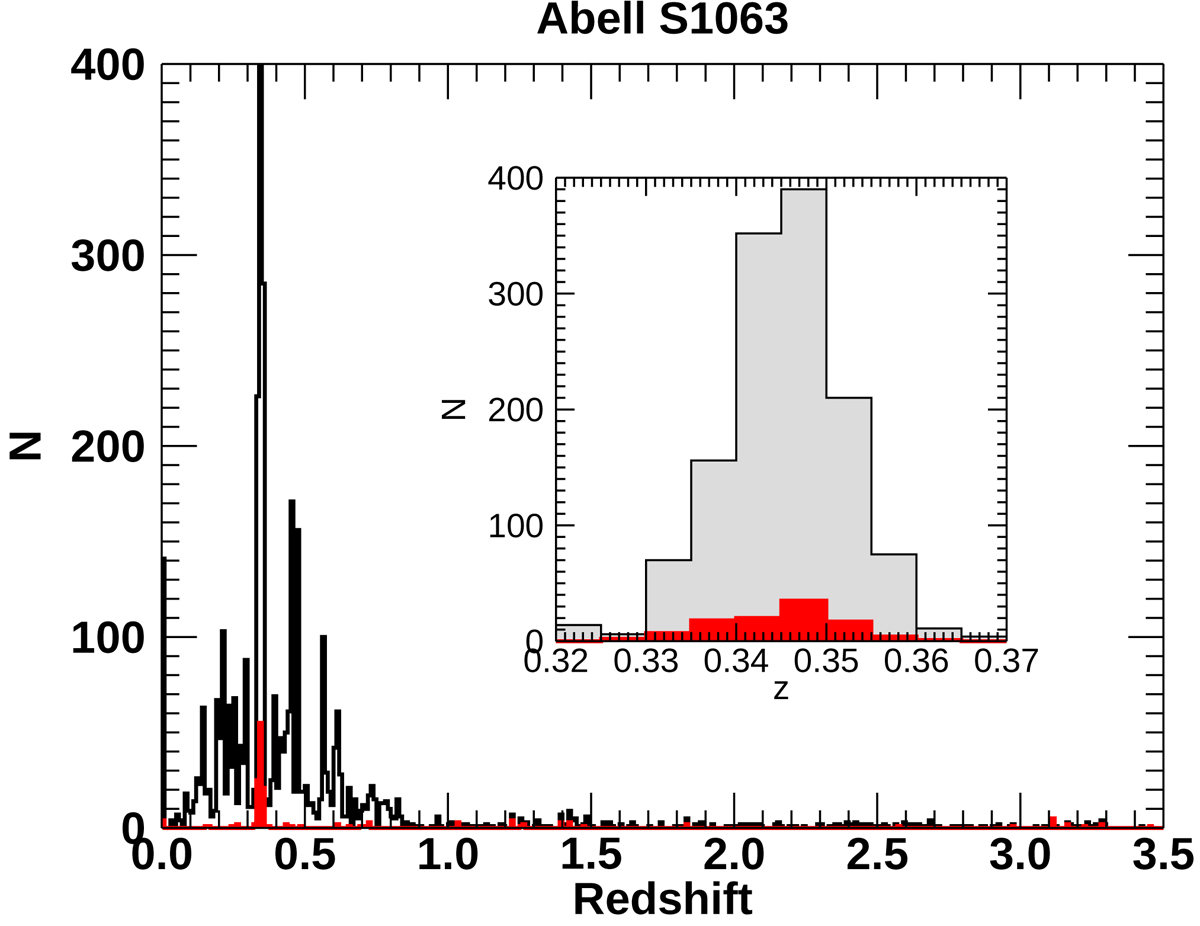
Download original image
Spectroscopic redshift distribution of 3850 sources in A S1063 from the CLASH-VLT catalogue, including 175 MUSE redshifts. The inset shows a zoom-in around the mean cluster redshift ⟨zcl⟩ = 0.3457 (red histogram for MUSE galaxies) of the 1234 cluster members found from the kinematic analysis.
Current usage metrics show cumulative count of Article Views (full-text article views including HTML views, PDF and ePub downloads, according to the available data) and Abstracts Views on Vision4Press platform.
Data correspond to usage on the plateform after 2015. The current usage metrics is available 48-96 hours after online publication and is updated daily on week days.
Initial download of the metrics may take a while.