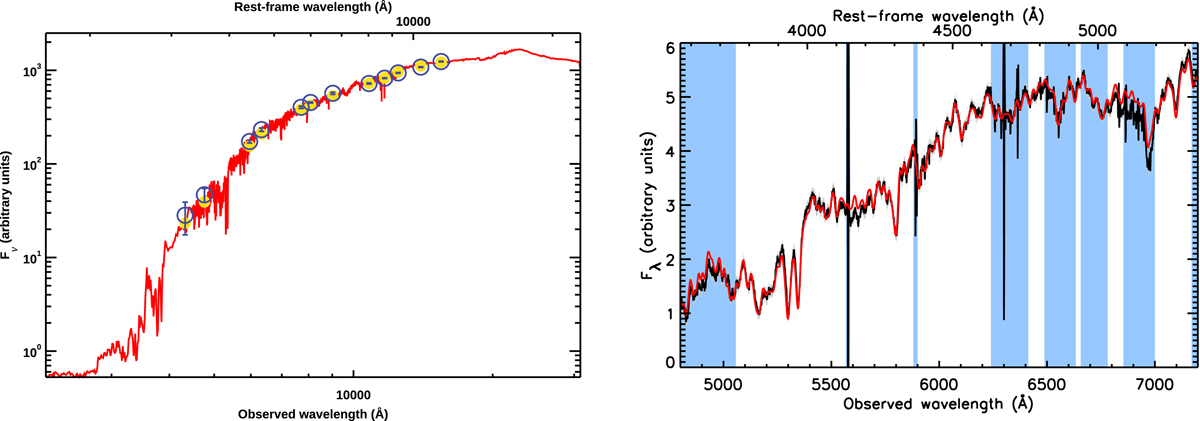
Fig. C.1.
Download original image
Example of the composite stellar population modelling of the 12 OPT/NIR HST bands (left panel, open blue symbols) plus MUSE spectra (right panel, black line) of the BCG. The best fit is shown in red in both panels. In the left panel, blue empty circles and bars are the observed fluxes with 1σ errors, and filled yellow circles are model-predicted HST fluxes. In the right panel, blue areas indicate the masked regions.
Current usage metrics show cumulative count of Article Views (full-text article views including HTML views, PDF and ePub downloads, according to the available data) and Abstracts Views on Vision4Press platform.
Data correspond to usage on the plateform after 2015. The current usage metrics is available 48-96 hours after online publication and is updated daily on week days.
Initial download of the metrics may take a while.