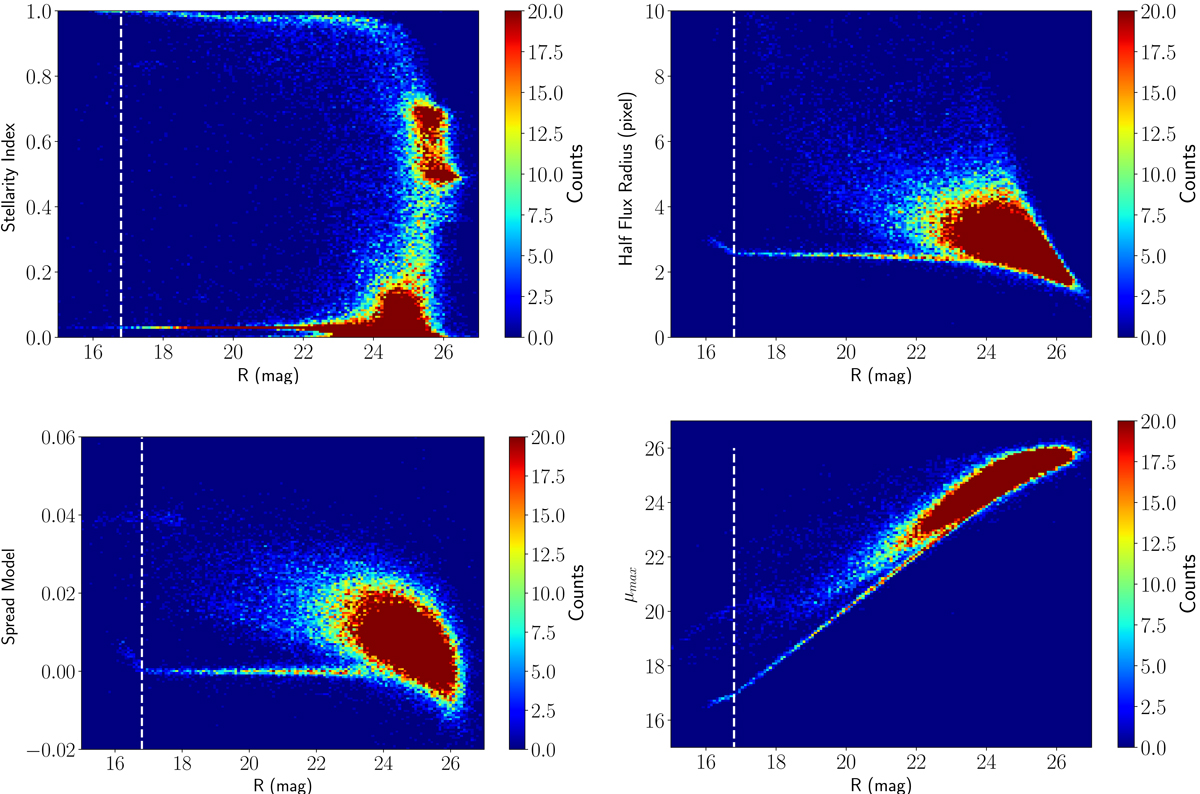
Fig. A.1.
Download original image
Two-dimensional histogram of SExtractor stellarity index (top left panel), half-light radius (top right panel), spread model (bottom left panel), and μmax (bottom right panel) as a function of the Kron magnitudes for sources in the R-band image. The vertical dashed line in all panels is the magnitude limit we adopted for saturated objects. The points are colour-coded according to their number counts as reported in the vertical colour bars.
Current usage metrics show cumulative count of Article Views (full-text article views including HTML views, PDF and ePub downloads, according to the available data) and Abstracts Views on Vision4Press platform.
Data correspond to usage on the plateform after 2015. The current usage metrics is available 48-96 hours after online publication and is updated daily on week days.
Initial download of the metrics may take a while.