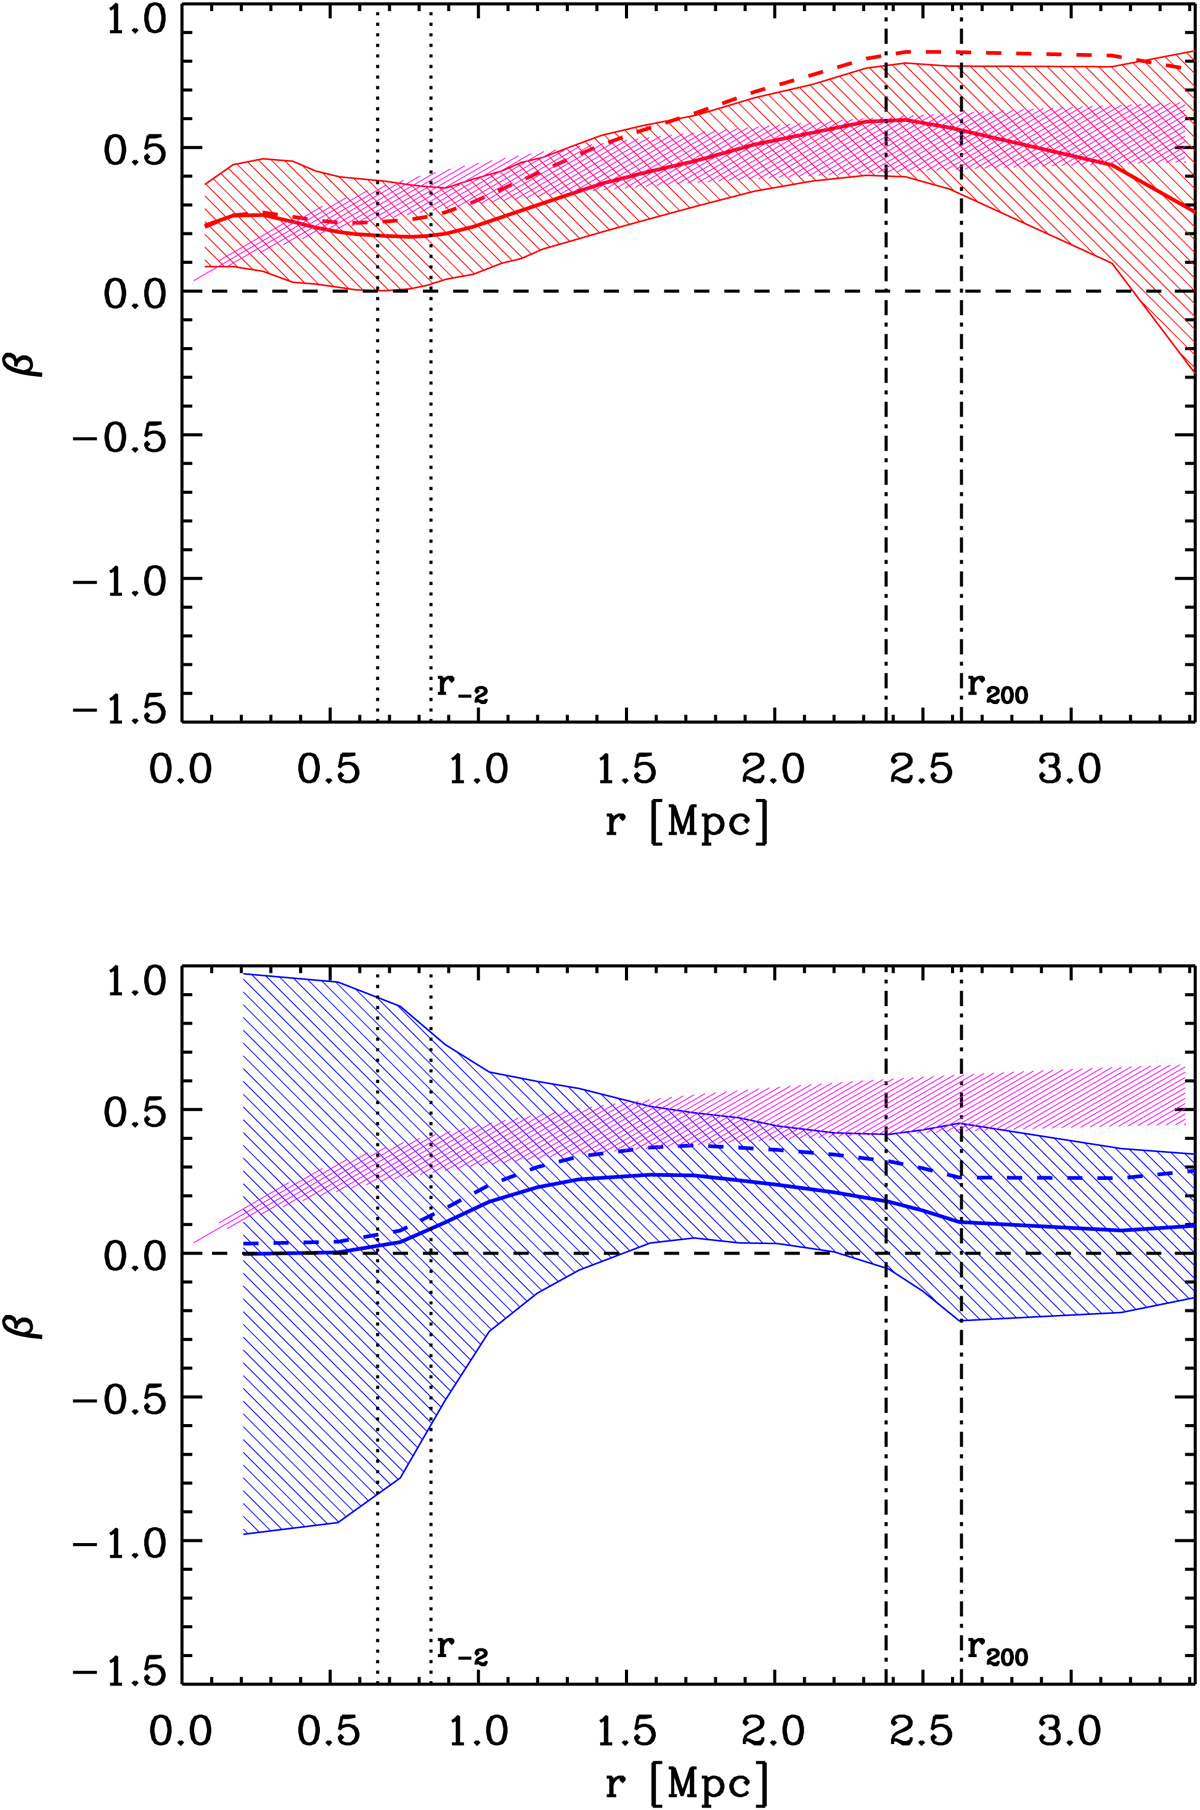
Fig. 21.
Download original image
Velocity anisotropy profiles of the red and blue cluster members in the upper and lower panels, respectively. The solid (dashed) coloured lines represent the solutions of the inversion of the Jeans equation adopting the mass profile from Sartoris et al. (2020) (Umetsu et al. 2016). The coloured area indicates the 68% confidence region around the solution. The magenta shading indicates the 68% confidence region around the MAMPOSSt best-fit solution for a Tiret model (Sartoris et al. 2020). In both panels we use the same Tiret model, which was computed considering the full sample of member galaxies. The vertical dotted and dash-dotted black lines mark r−2 (which corresponds to rs for an NFW model) and r200 obtained from Umetsu et al. (2016) and the MAMPOSSt analysis of Sartoris et al. (2020), respectively.
Current usage metrics show cumulative count of Article Views (full-text article views including HTML views, PDF and ePub downloads, according to the available data) and Abstracts Views on Vision4Press platform.
Data correspond to usage on the plateform after 2015. The current usage metrics is available 48-96 hours after online publication and is updated daily on week days.
Initial download of the metrics may take a while.