Free Access
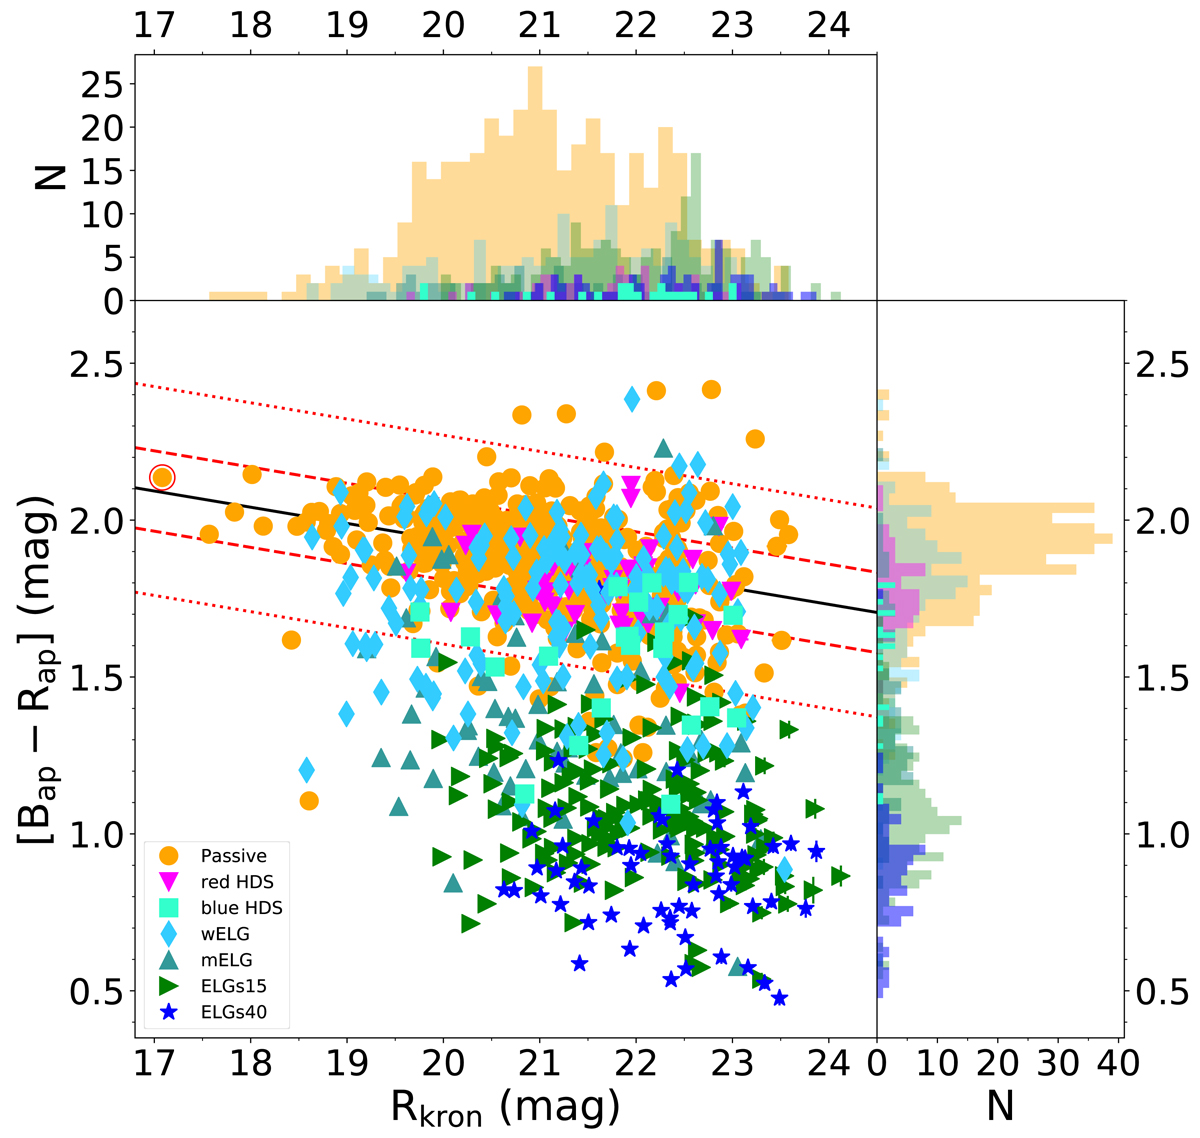
Fig. 14.
Download original image
Colour-magnitude relation of 960 spectroscopic members in A S1063 with reliable spectral classification. The best-fit of the CM is indicated by the black line, and 68% and 99% limits are marked as dashed and dotted red lines, respectively. The red empty circle highlights the BCG.
Current usage metrics show cumulative count of Article Views (full-text article views including HTML views, PDF and ePub downloads, according to the available data) and Abstracts Views on Vision4Press platform.
Data correspond to usage on the plateform after 2015. The current usage metrics is available 48-96 hours after online publication and is updated daily on week days.
Initial download of the metrics may take a while.