Fig. 1.
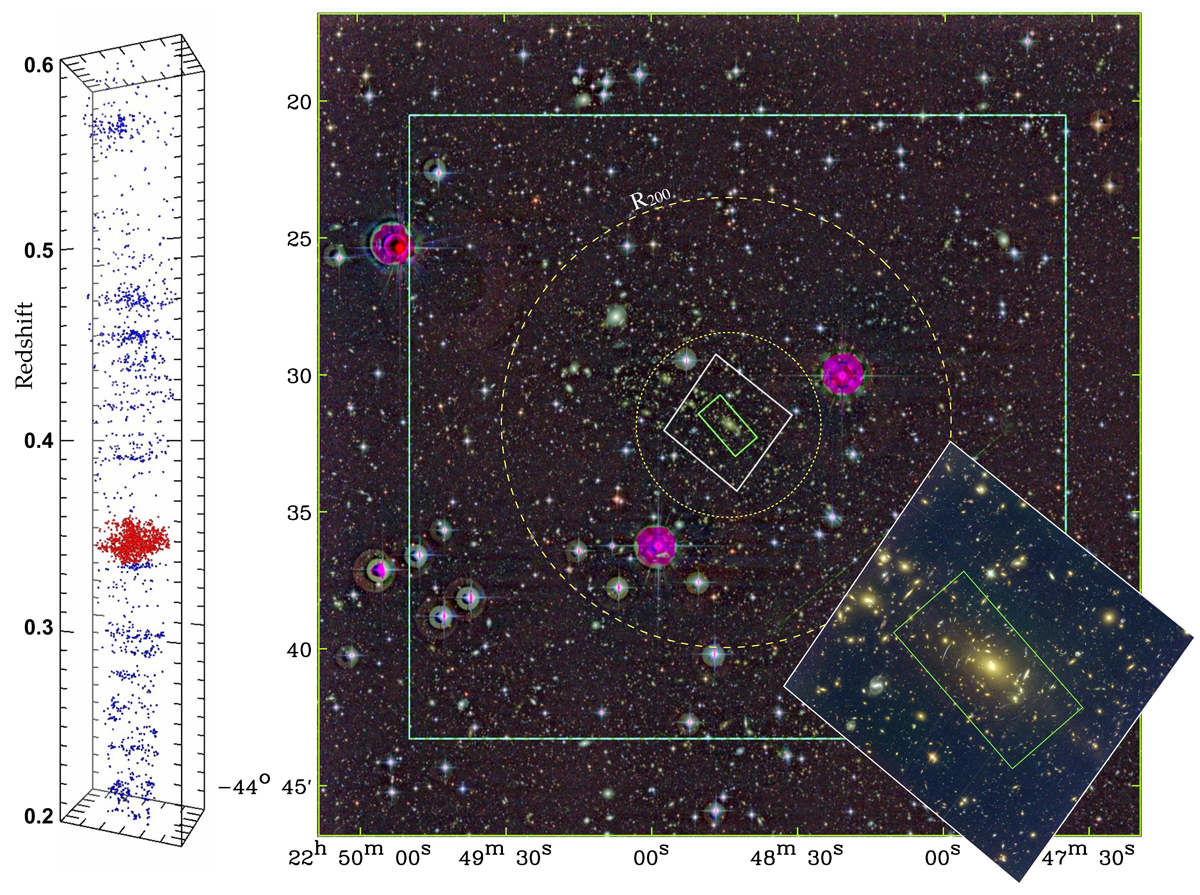
Download original image
Ground-based and HST color image of the galaxy cluster Abell S1063 with the wedge redshift diagram from the CLASH-VLT survey. Right panel: WFI colour-composite image of A S1063 (UBVRIz, 30 × 30 arcmin2). The cyan square indicates the VIMOS spectroscopic survey area (28.9 × 22.7 arcmin2), and the white and green polygons indicate the HST FF colour-composite image (F435W, F606W, and F814W) and the footprint of MUSE observations (two pointings, 2 × 1 arcmin2) enlarged in the inset. The dotted and dashed circles have radii R = 1 Mpc and R = r200, respectively. Left panel: 3D spatial distribution of all measured redshifts at 0.2 < z < 0.6, where cluster members are marked in red.
Current usage metrics show cumulative count of Article Views (full-text article views including HTML views, PDF and ePub downloads, according to the available data) and Abstracts Views on Vision4Press platform.
Data correspond to usage on the plateform after 2015. The current usage metrics is available 48-96 hours after online publication and is updated daily on week days.
Initial download of the metrics may take a while.