Fig. 4
Download original image
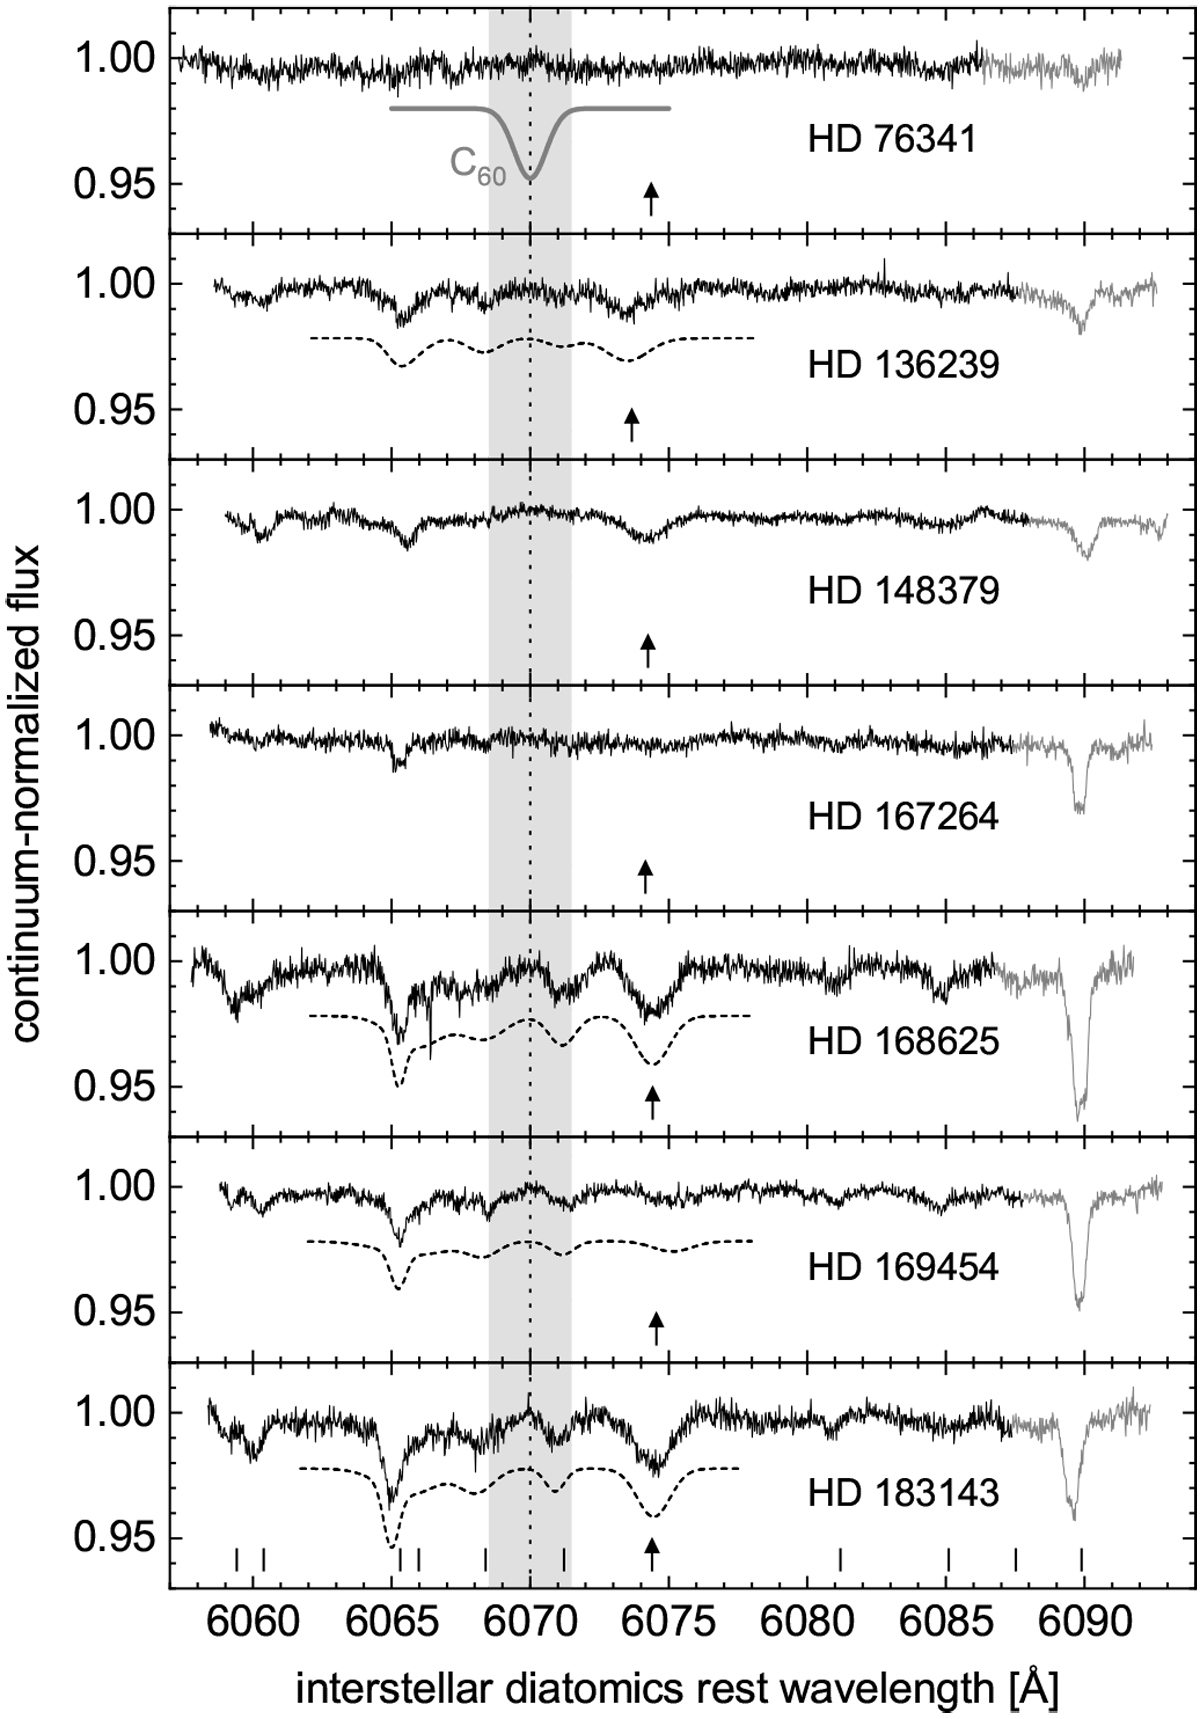
Continuum-normalized spectra with interstellar wavelength scale for seven LOSs in the 6000 Å region. Each gray portion was obtained by extrapolating the straight continuum defined over the 6058–6087 Å interval (observer rest frame). The top panel includes a synthetic γ0 band of C60 of arbitrary equivalent width (thick gray solid curve, offset for clarity). Its position is indicated through all panels (vertical dotted line). Positions of DIBs according to Hobbs et al. (2009) are indicated in the bottom panel (short vertical lines). The predicted position of a line of stellar Ne I is marked in each panel (arrow). Synthetic spectra of DIBs and the Ne I line are represented in four panels (short-dashed curve). The light gray area indicates the wavelength interval of two FWHMs taken into account to evaluate uW(C60, γ0) at 6070 Å for each LOS.
Current usage metrics show cumulative count of Article Views (full-text article views including HTML views, PDF and ePub downloads, according to the available data) and Abstracts Views on Vision4Press platform.
Data correspond to usage on the plateform after 2015. The current usage metrics is available 48-96 hours after online publication and is updated daily on week days.
Initial download of the metrics may take a while.