Fig. 3
Download original image
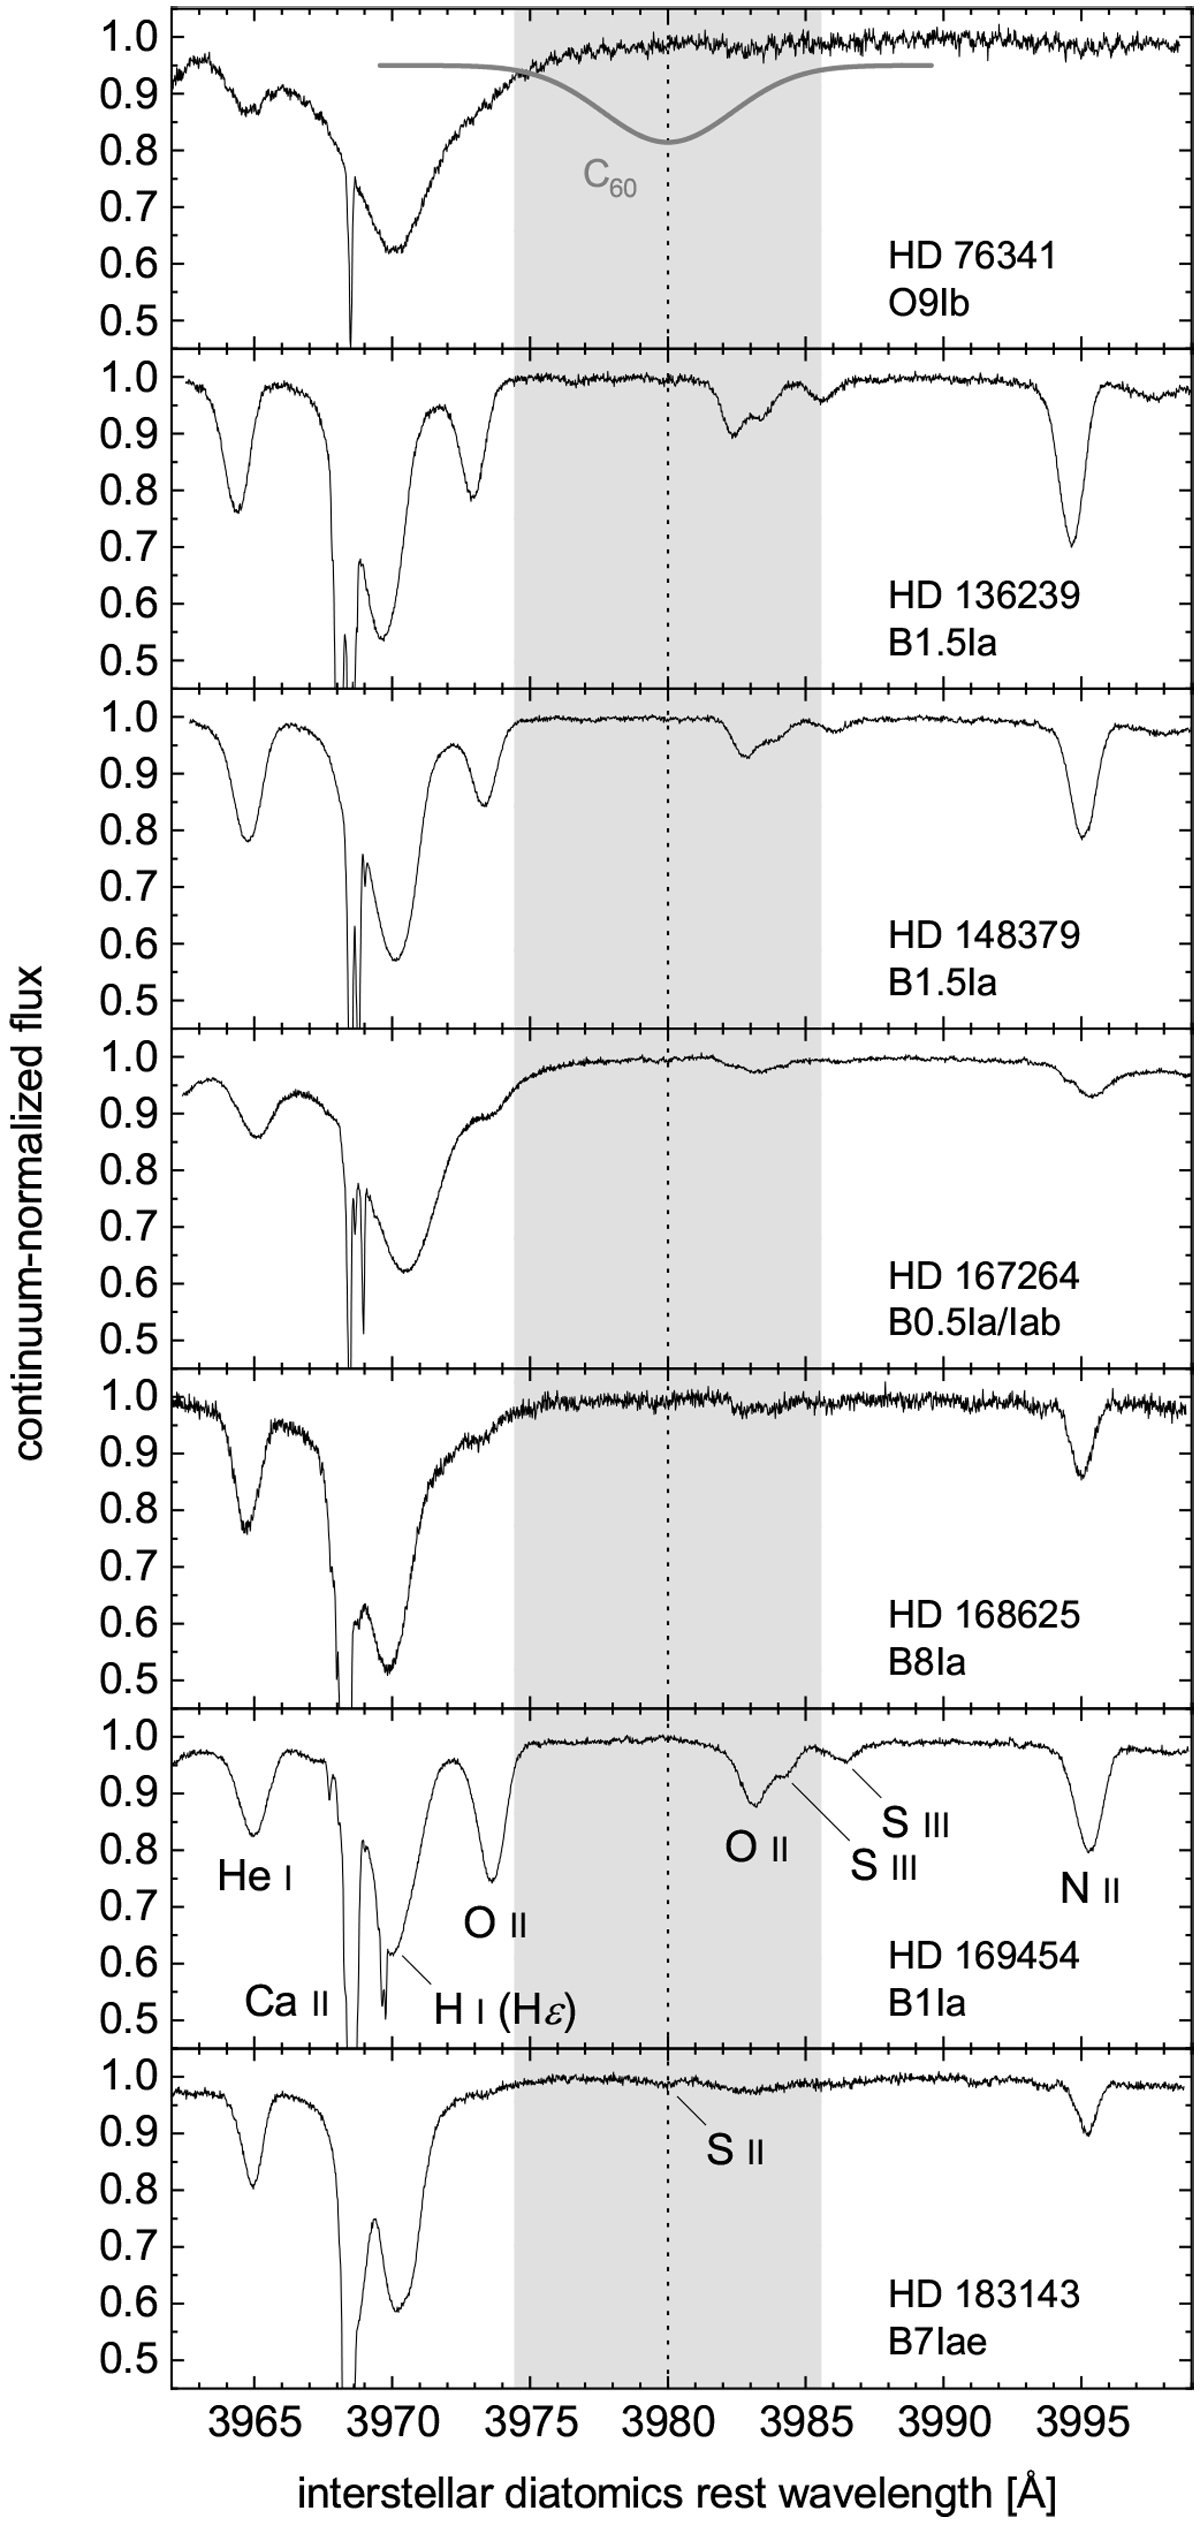
Normalized observational spectra (black solid curves). A straight line continuum was defined over the 3960–4000 Å range of each spectrum still in the observer rest frame. The top panel includes a synthetic A1 band of C60 with expected position and width, and arbitrary equivalent width (thick gray solid curve). Its position is indicated through all panels (vertical dotted line). The light gray area indicates the wavelength interval of two FWHMs taken into account to evaluate uW(C60, A1) at 3980 Å for each LOS. The spectral type of each target star is indicated.
Current usage metrics show cumulative count of Article Views (full-text article views including HTML views, PDF and ePub downloads, according to the available data) and Abstracts Views on Vision4Press platform.
Data correspond to usage on the plateform after 2015. The current usage metrics is available 48-96 hours after online publication and is updated daily on week days.
Initial download of the metrics may take a while.