Fig. 1
Download original image
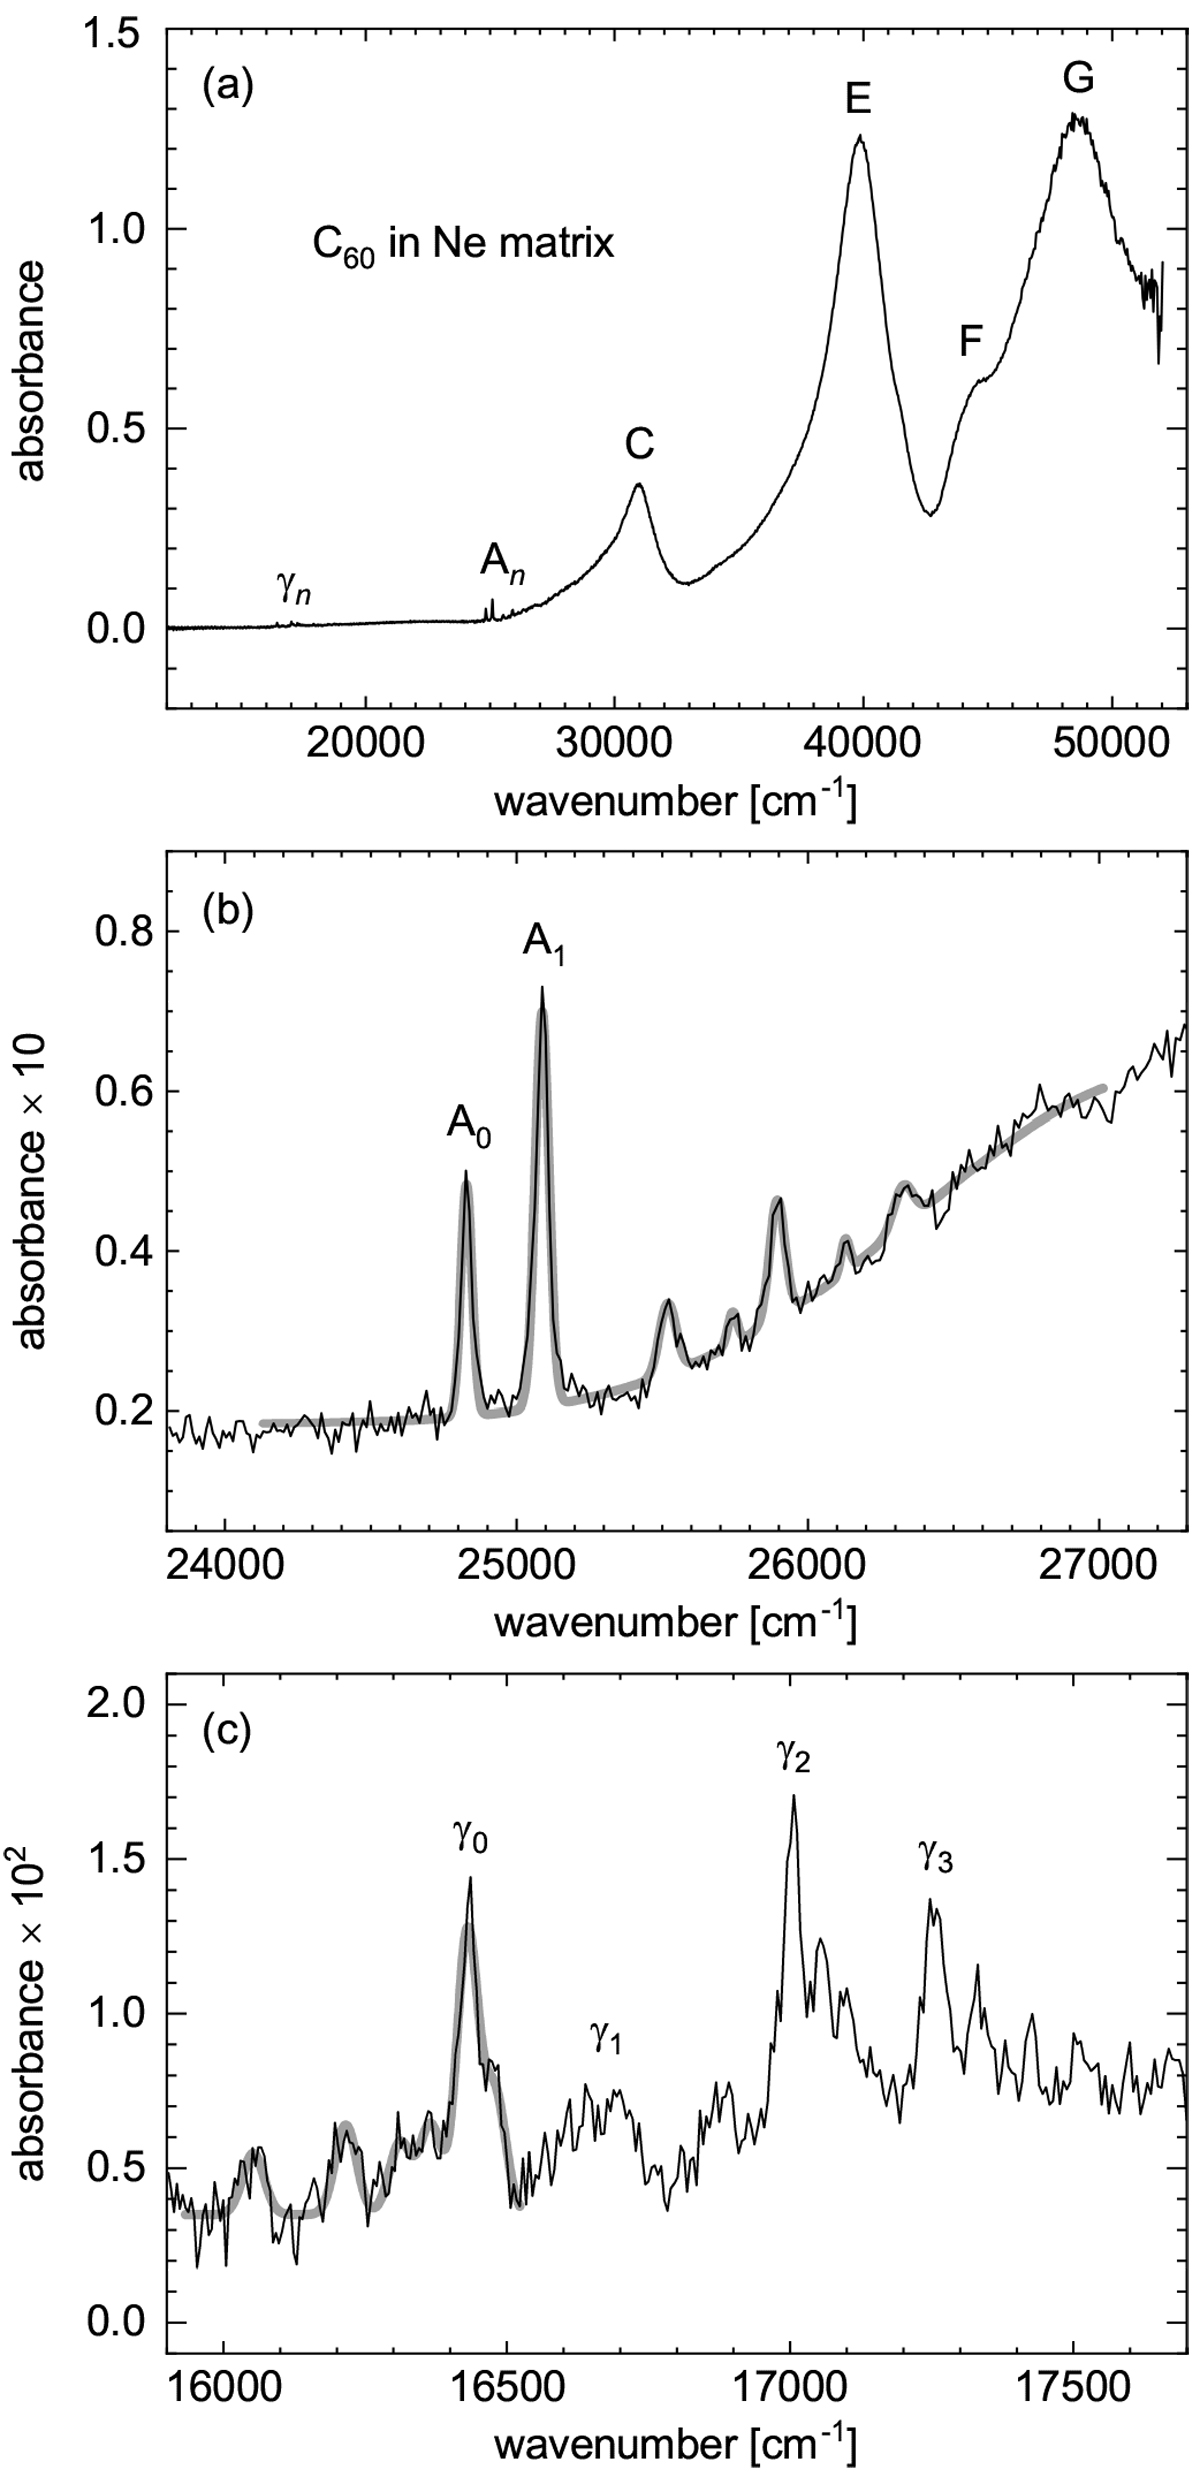
(a) Absorption spectrum of C60 isolated in a Ne matrix, not corrected for scattering. Band labels according to Leach et al. (1992). (b) Gaussian profiles (thick gray solid curve) fitted to bands of the 11 T1u ←1Ag transition, including A0 and A1, and to the baseline. (c) Gaussian profiles (thick gray solid curve) fitted, with a common FWHM, to absorptions near the γ0 band. Fittedband positions are 16 431.1 ± 1.2 cm−1, 24 829.04 ± 0.98 cm−1, and 25 087.73 ± 0.65 cm−1 for γ0, A0, and A1, respectively.The wavelength scale of the spectrometer was calibrated with an accuracy of 0.3 nm.
Current usage metrics show cumulative count of Article Views (full-text article views including HTML views, PDF and ePub downloads, according to the available data) and Abstracts Views on Vision4Press platform.
Data correspond to usage on the plateform after 2015. The current usage metrics is available 48-96 hours after online publication and is updated daily on week days.
Initial download of the metrics may take a while.