Fig. 4.
Download original image
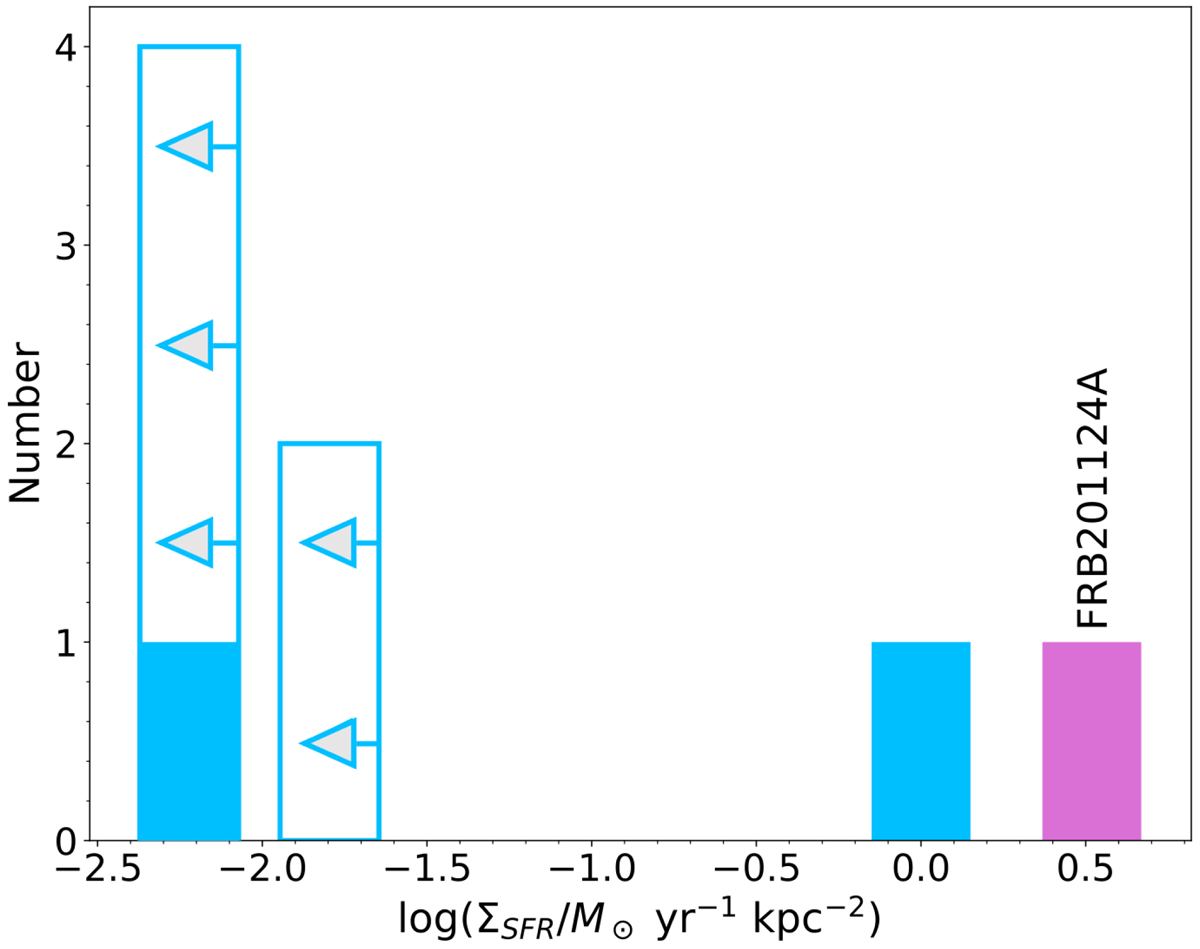
Local SFR density, ΣSFR(FRB), for FRB 20201124A (this work; magenta bar) compared to the sample of FRBs (from Mannings et al. 2021, with the exception of FRB 20121102A at 1 M⊙ yr−1 kpc−2, which was derived from Bassa et al. 2017; see text). Arrows represent upper limits, and solid blue bars represent measurements contained in each bin width.
Current usage metrics show cumulative count of Article Views (full-text article views including HTML views, PDF and ePub downloads, according to the available data) and Abstracts Views on Vision4Press platform.
Data correspond to usage on the plateform after 2015. The current usage metrics is available 48-96 hours after online publication and is updated daily on week days.
Initial download of the metrics may take a while.