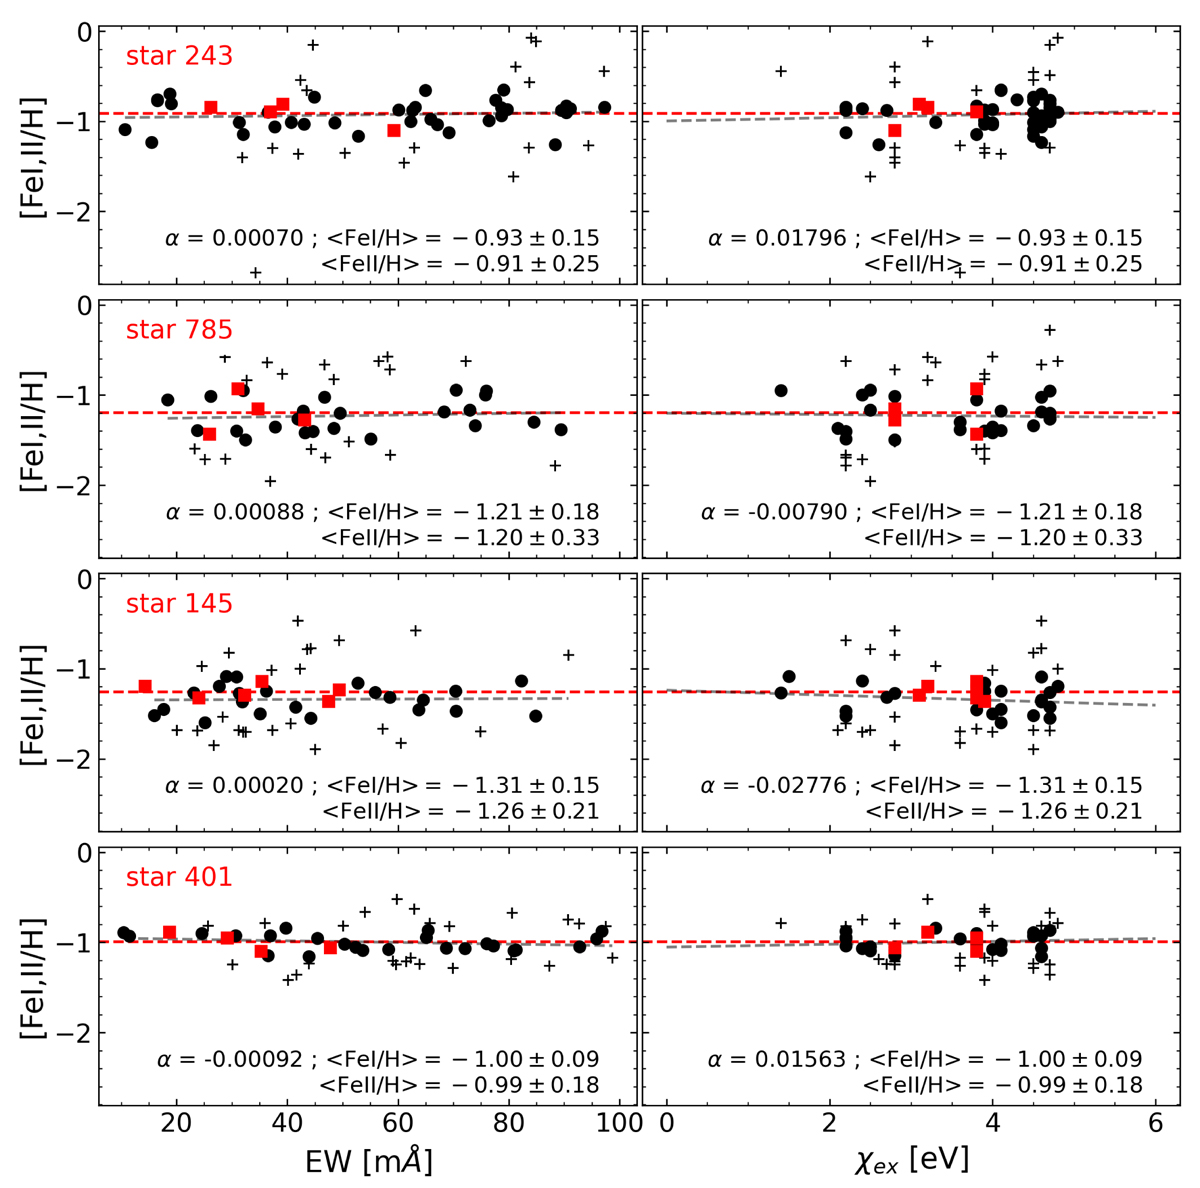
Fig. 4.
Download original image
Excitation and ionisation equilibria of Fe I and Fe II lines for the four member stars. The black dots are the values considered to compute the metallicity of Fe I lines after a sigma-clipping of 1 − σ. The crosses are the omitted values. The red squares are the values of Fe II lines. The α values show the slope of the trends of Fe I lines.
Current usage metrics show cumulative count of Article Views (full-text article views including HTML views, PDF and ePub downloads, according to the available data) and Abstracts Views on Vision4Press platform.
Data correspond to usage on the plateform after 2015. The current usage metrics is available 48-96 hours after online publication and is updated daily on week days.
Initial download of the metrics may take a while.