Fig. 3.
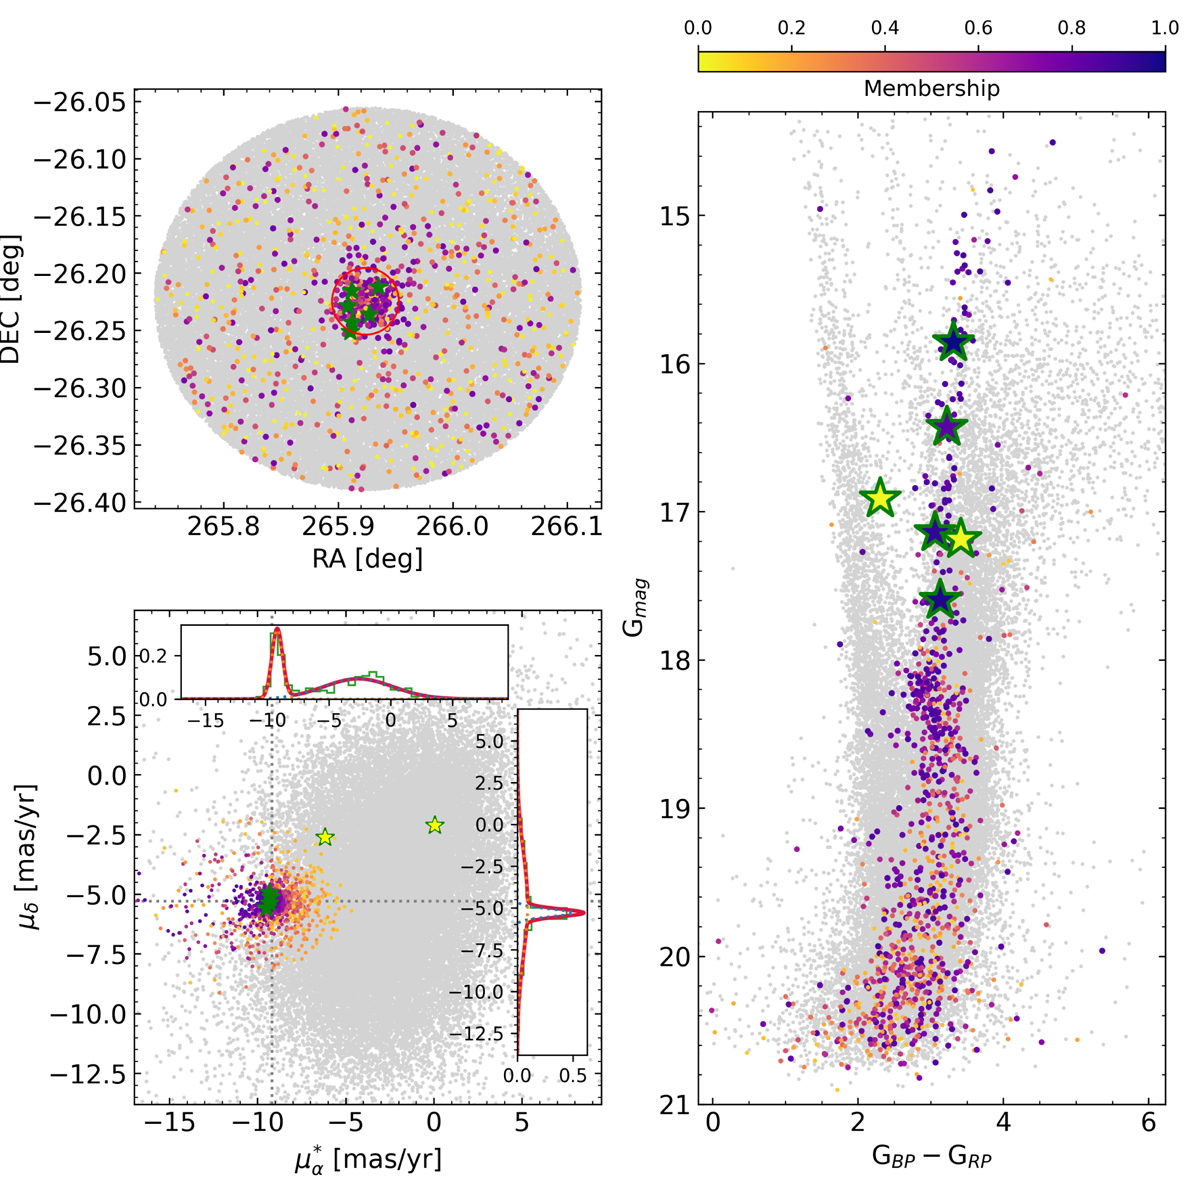
Download original image
Proper motion analysis to obtain the cluster members. Top left panel: sky distribution of stars within 10 arcmin of the cluster centre. Bottom left panel: vector point diagram with the cluster (coloured dots) and field (grey dots) stars; the green star symbols are the observed stars with FLAMES-UVES, and the insert plots show the density distributions found using GMMs. Right panel: Gaia EDR3 G versus GBP − GRP CMD; the green star symbols are the observed stars. From the bottom left and right panels, we can identify that two observed stars have zero membership probability (yellow star symbols).
Current usage metrics show cumulative count of Article Views (full-text article views including HTML views, PDF and ePub downloads, according to the available data) and Abstracts Views on Vision4Press platform.
Data correspond to usage on the plateform after 2015. The current usage metrics is available 48-96 hours after online publication and is updated daily on week days.
Initial download of the metrics may take a while.