Fig. 24.
Download original image
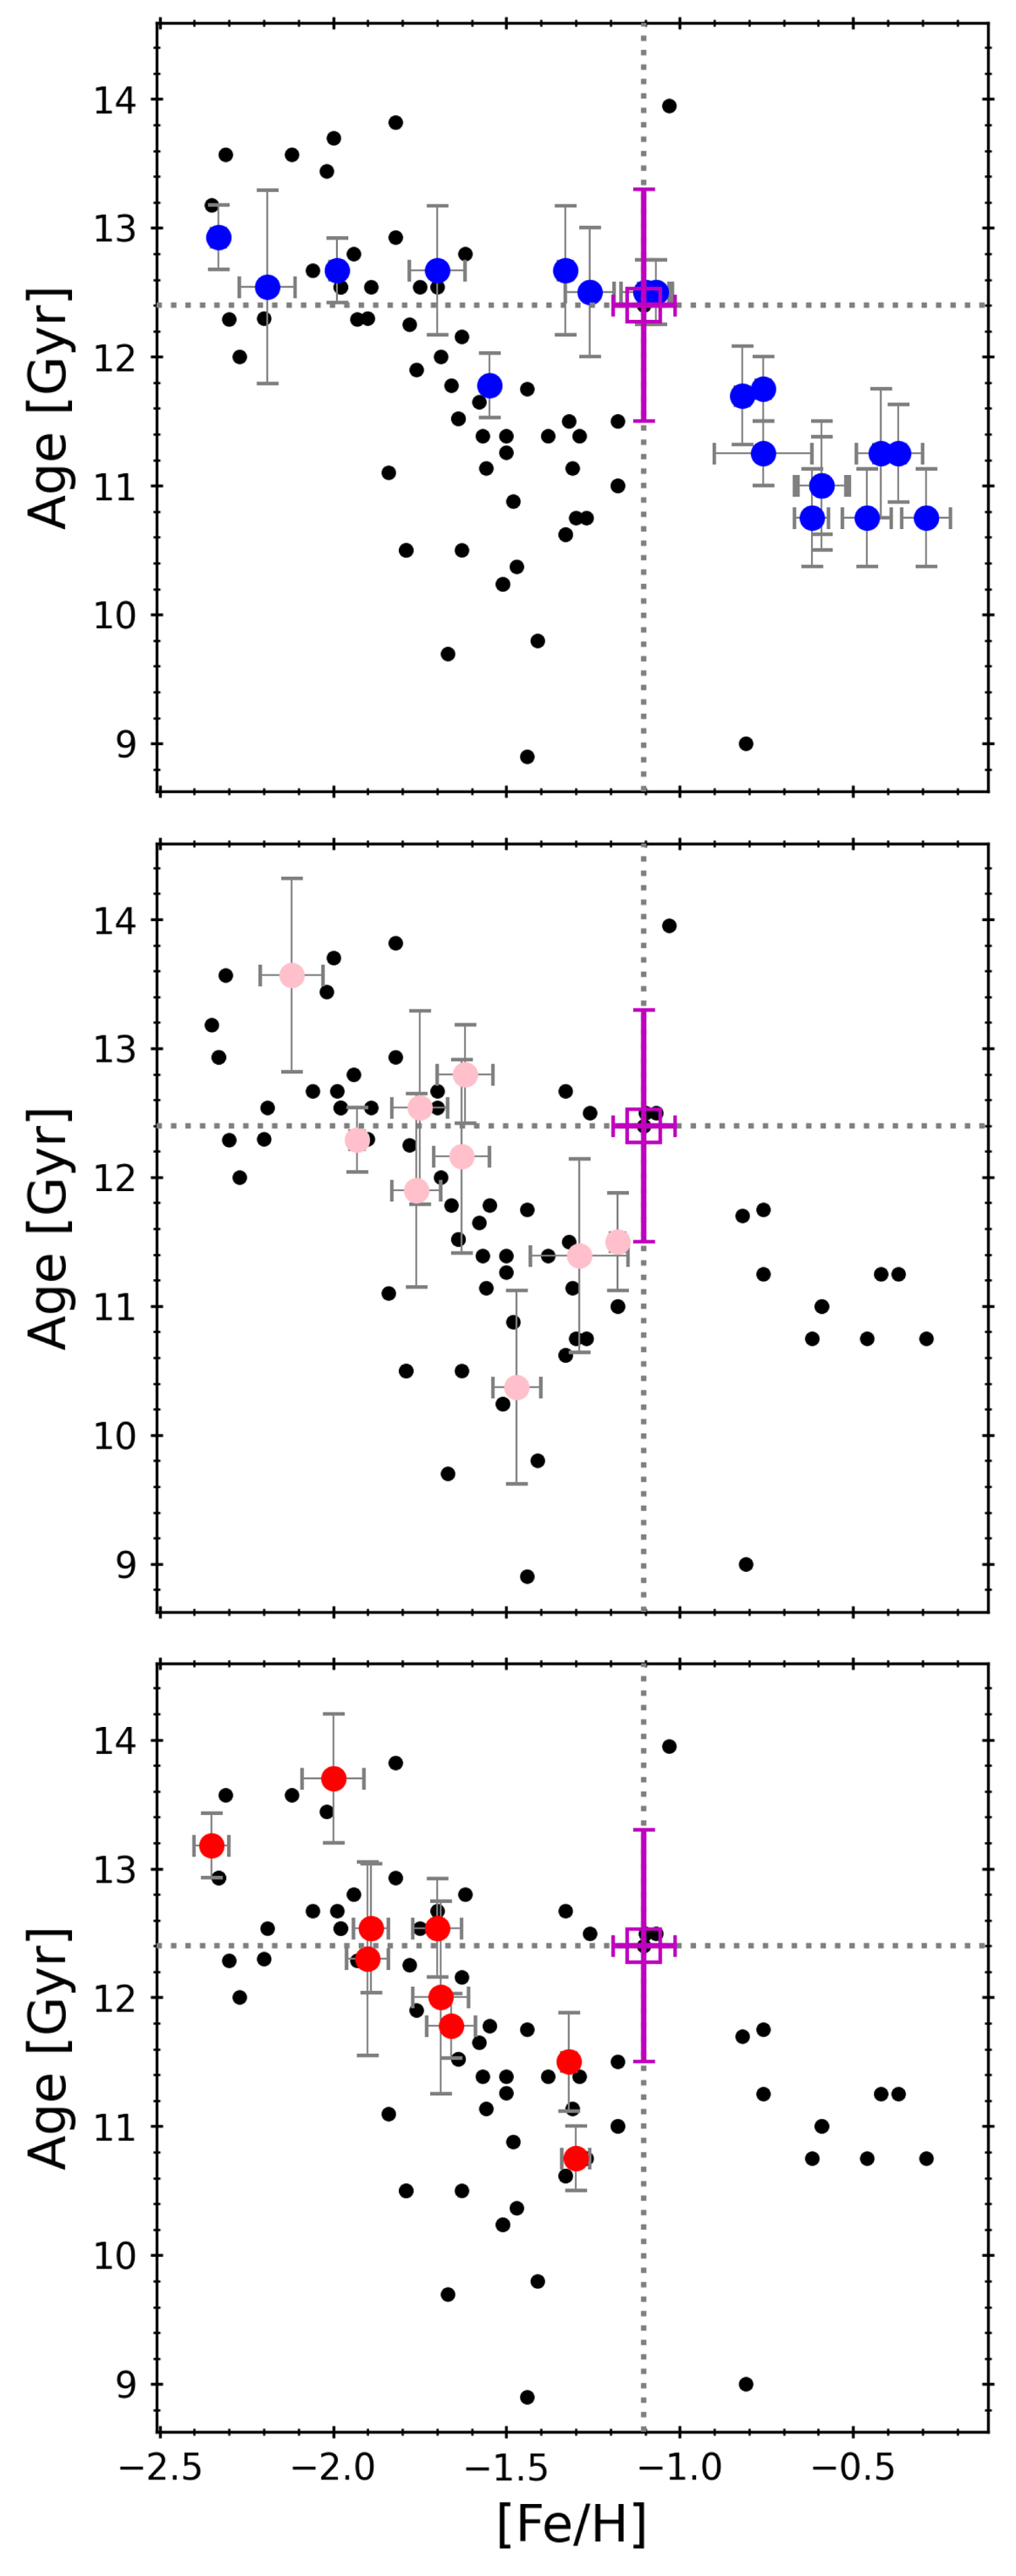
Age-metallicity relation (AMR) for 82 GCs (black dots) analysed by Massari et al. (2019) (plot based on their Fig. 4). The ages are taken from Vandenberg et al. (2013) and the metallicities from Carretta et al. (2009b). In each panel, one progenitor is highlighted. From top to bottom: First panel, main-progenitor (disc and bulge); second panel, low energy; third panel, Gaia-Enceladus. The magenta square represents Pal 6 with metallicity and age of the present work.
Current usage metrics show cumulative count of Article Views (full-text article views including HTML views, PDF and ePub downloads, according to the available data) and Abstracts Views on Vision4Press platform.
Data correspond to usage on the plateform after 2015. The current usage metrics is available 48-96 hours after online publication and is updated daily on week days.
Initial download of the metrics may take a while.