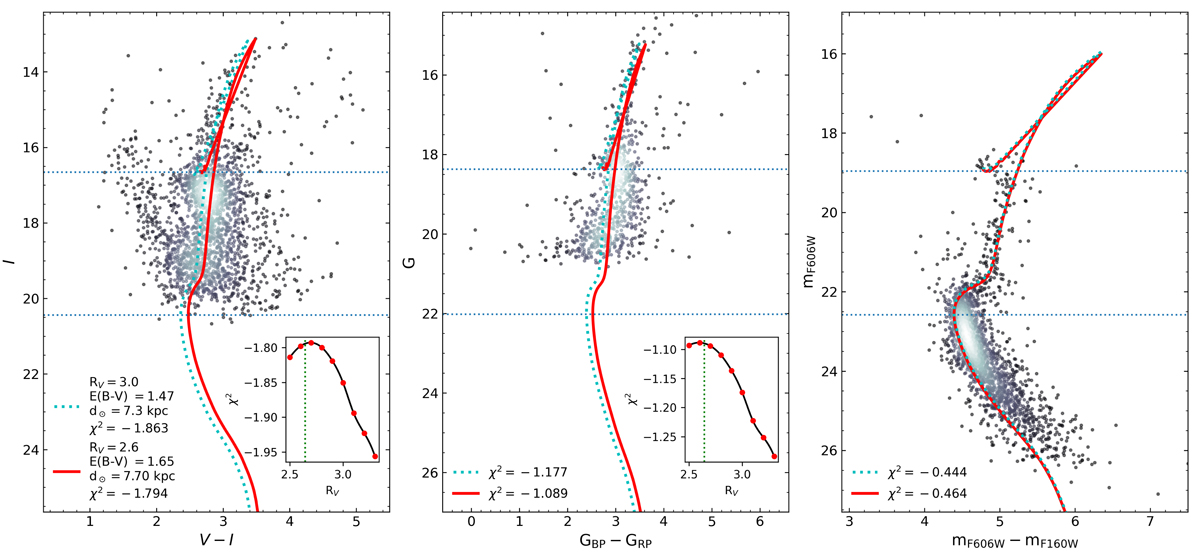
Fig. 20.
Download original image
Posterior fitting to obtain the best value of RV. First panel: optical CMD V − I versus I from Ortolani et al. (1995). Second panel: Gaia EDR3 GBP − GRP versus G CMD. Third panel: corrected NIR HST CMD. The cyan dotted lines are the isochrones considering the best fit from the standard isochrone fitting and standard extinction coefficient (RV = 3.0). The embedded plots show the χ2 function to the variation of RV. The solid red lines are the isochrones with the best RV value. Finally, the blue horizontal lines denote the isochrone HB and turn-off mean locus.
Current usage metrics show cumulative count of Article Views (full-text article views including HTML views, PDF and ePub downloads, according to the available data) and Abstracts Views on Vision4Press platform.
Data correspond to usage on the plateform after 2015. The current usage metrics is available 48-96 hours after online publication and is updated daily on week days.
Initial download of the metrics may take a while.