Free Access
Fig. 17.
Download original image
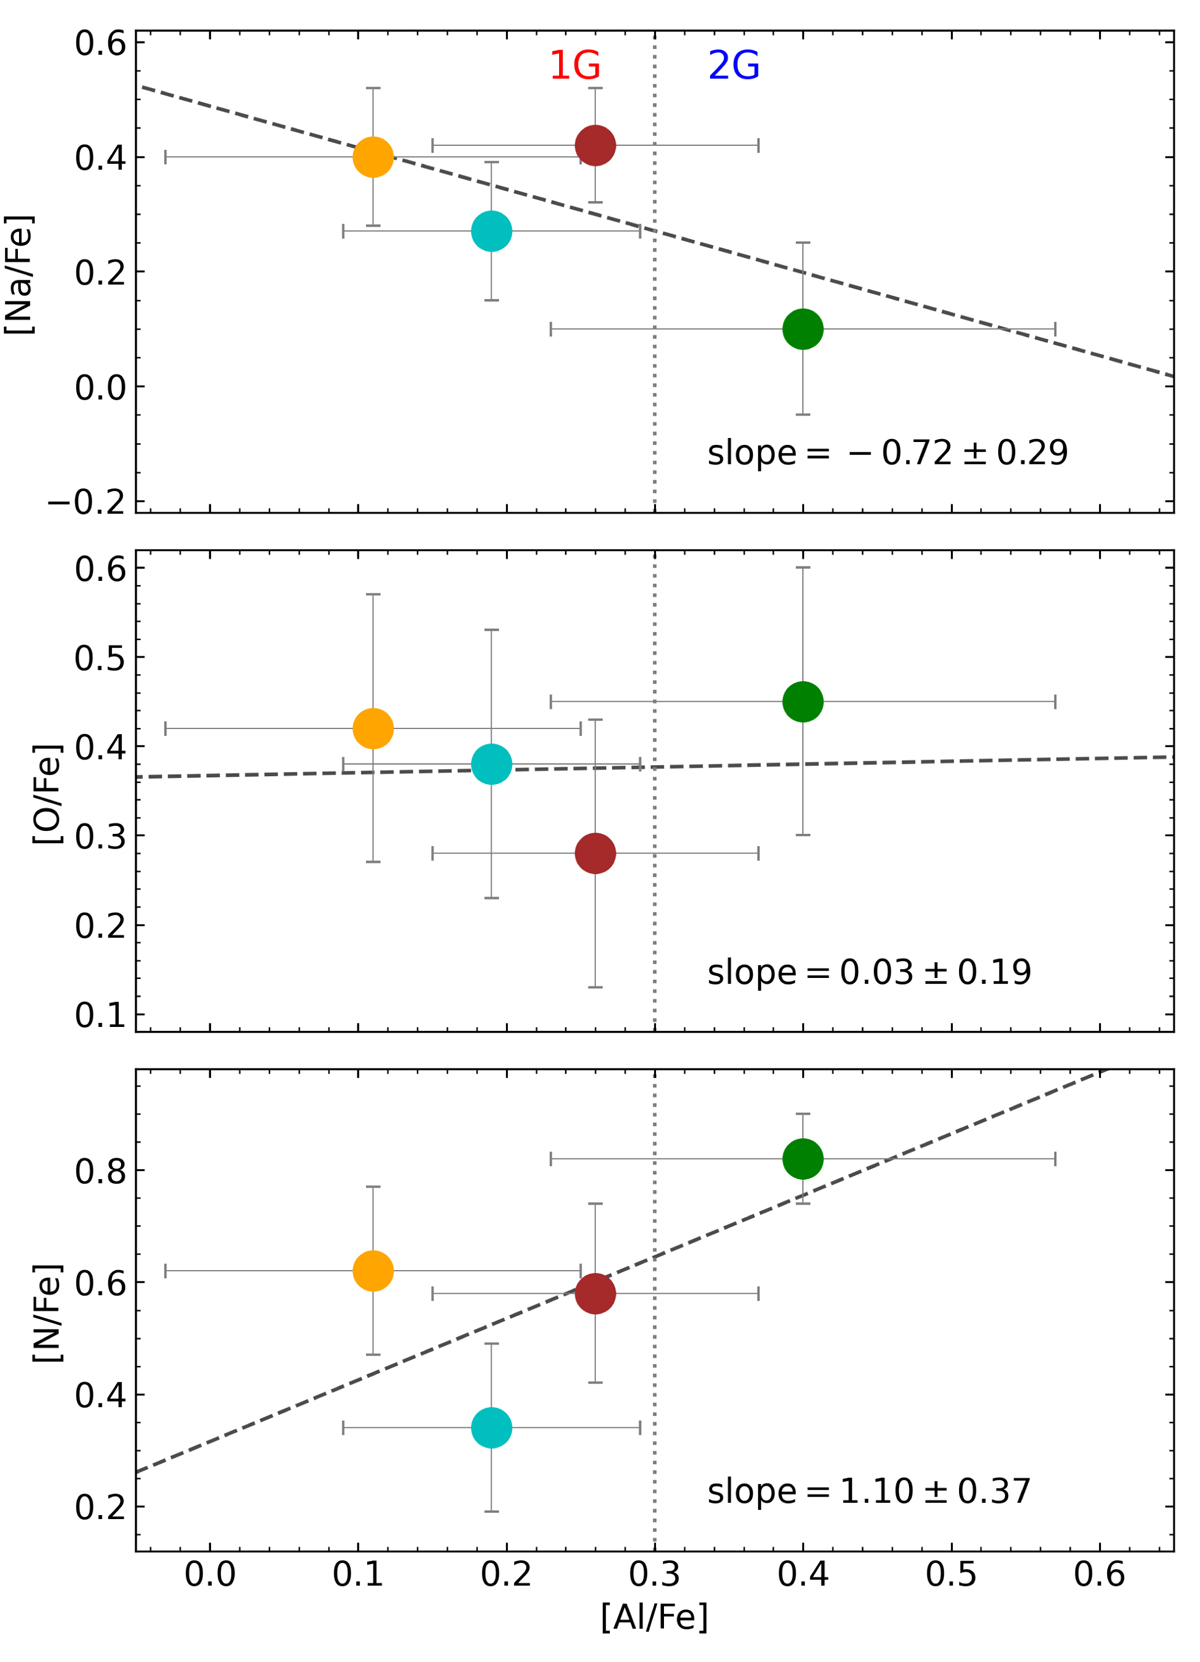
Al-NaON (anti)correlations. The dots are coloured according to the same colour code of Fig. 16. The dotted grey line represents the generation split around [Al/Fe] = +0.30 (Mészáros et al. 2020). The black dashed lines show the obtained linear regression.
Current usage metrics show cumulative count of Article Views (full-text article views including HTML views, PDF and ePub downloads, according to the available data) and Abstracts Views on Vision4Press platform.
Data correspond to usage on the plateform after 2015. The current usage metrics is available 48-96 hours after online publication and is updated daily on week days.
Initial download of the metrics may take a while.