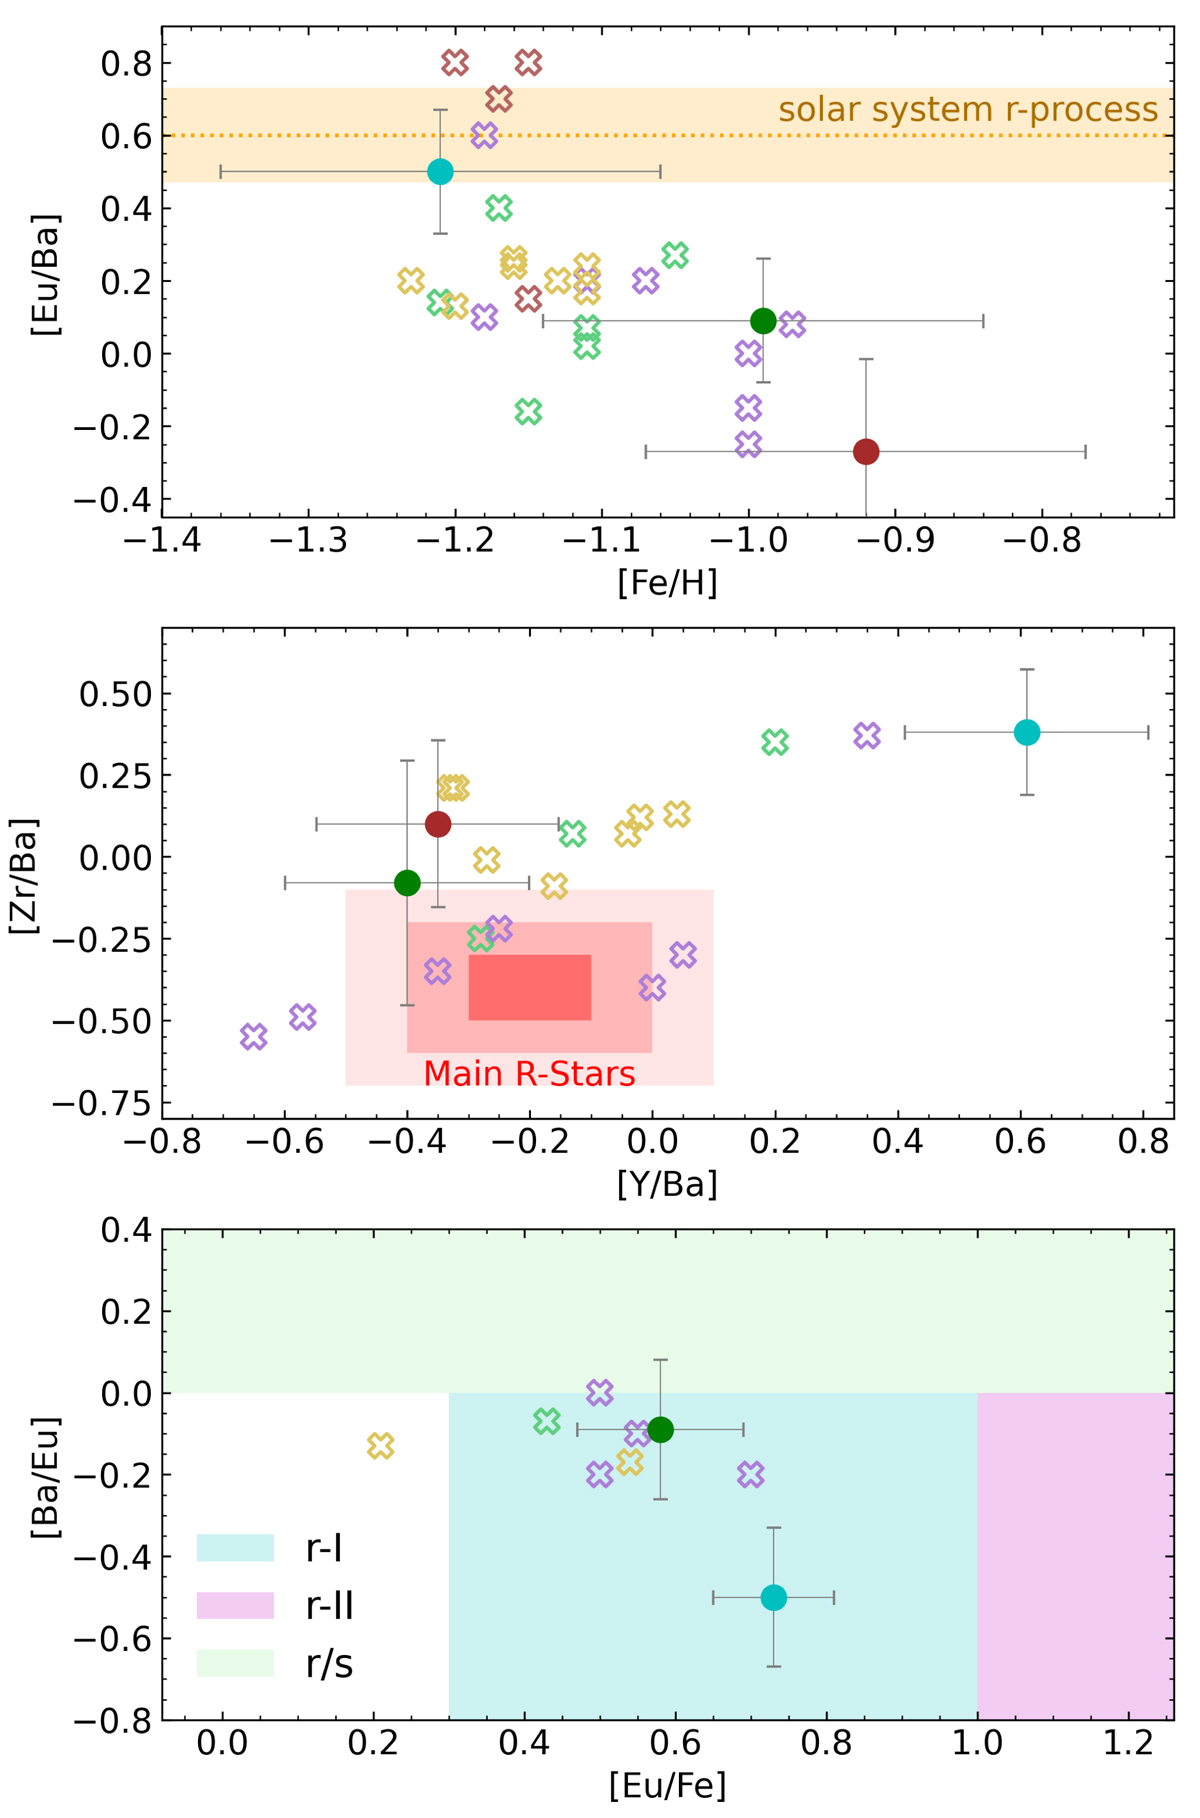
Fig. 15.
Download original image
Heavy-element enhancement diagnostic. Top panel: [Eu/Ba] versus [Fe/H] diagram for the four reference GCs. The Solar System r-process region is highlighted by the orange strip for [Eu/Ba] = +0.60 ± 0.13 (see text). Middle panel: [Zr/Ba] versus [Y/Ba] diagram for the three reference GCs that have Zr, Y, and Ba abundance determinations. The main r-process stars region is represented with the red-square (3 − σ). Bottom panel: [Ba/Eu] versus [Eu/Fe] diagram for the selected r-rich stars from the upper panel (see text). The light green region represents the regime of enhancement by both the r- and s-processes. The cyan and magenta regions show the domains of mainly r-process enhancement. The dot and cross colour code is the same as in Fig. 8.
Current usage metrics show cumulative count of Article Views (full-text article views including HTML views, PDF and ePub downloads, according to the available data) and Abstracts Views on Vision4Press platform.
Data correspond to usage on the plateform after 2015. The current usage metrics is available 48-96 hours after online publication and is updated daily on week days.
Initial download of the metrics may take a while.