Free Access
Fig. 8.
Download original image
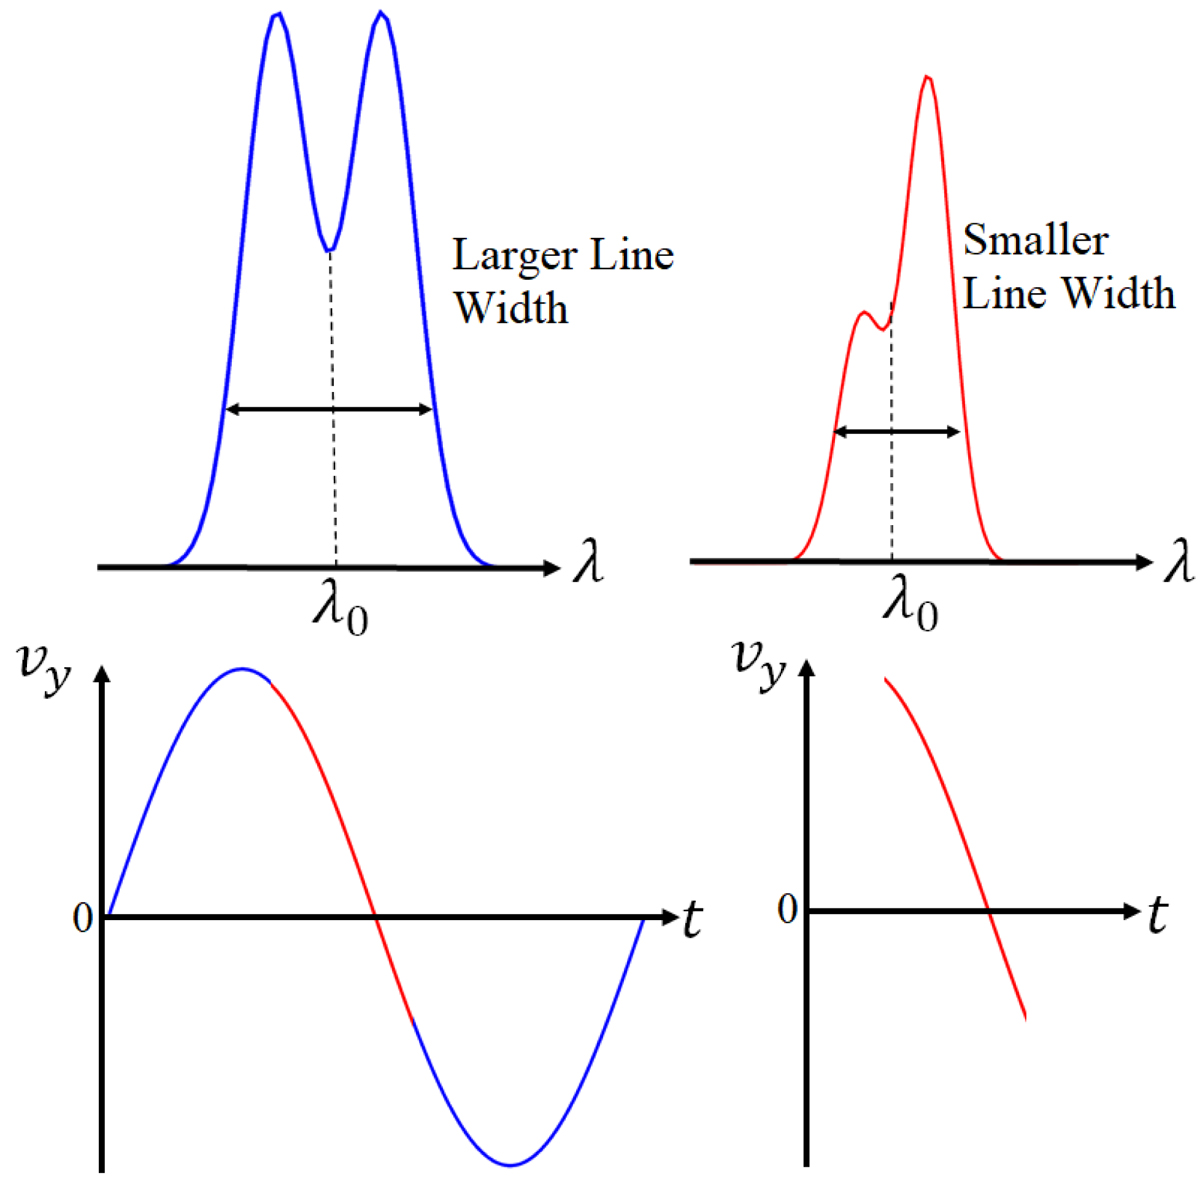
Example of under-sampling a wave period. Bottom row: is the wave present over two different exposure times. The red wave (right) is a subset of the blue wave (left) where the blue wave has an exposure time equal to the period of the driver. Top row: depicts the specific intensity over the two different exposure times.
Current usage metrics show cumulative count of Article Views (full-text article views including HTML views, PDF and ePub downloads, according to the available data) and Abstracts Views on Vision4Press platform.
Data correspond to usage on the plateform after 2015. The current usage metrics is available 48-96 hours after online publication and is updated daily on week days.
Initial download of the metrics may take a while.