Fig. 6.
Download original image
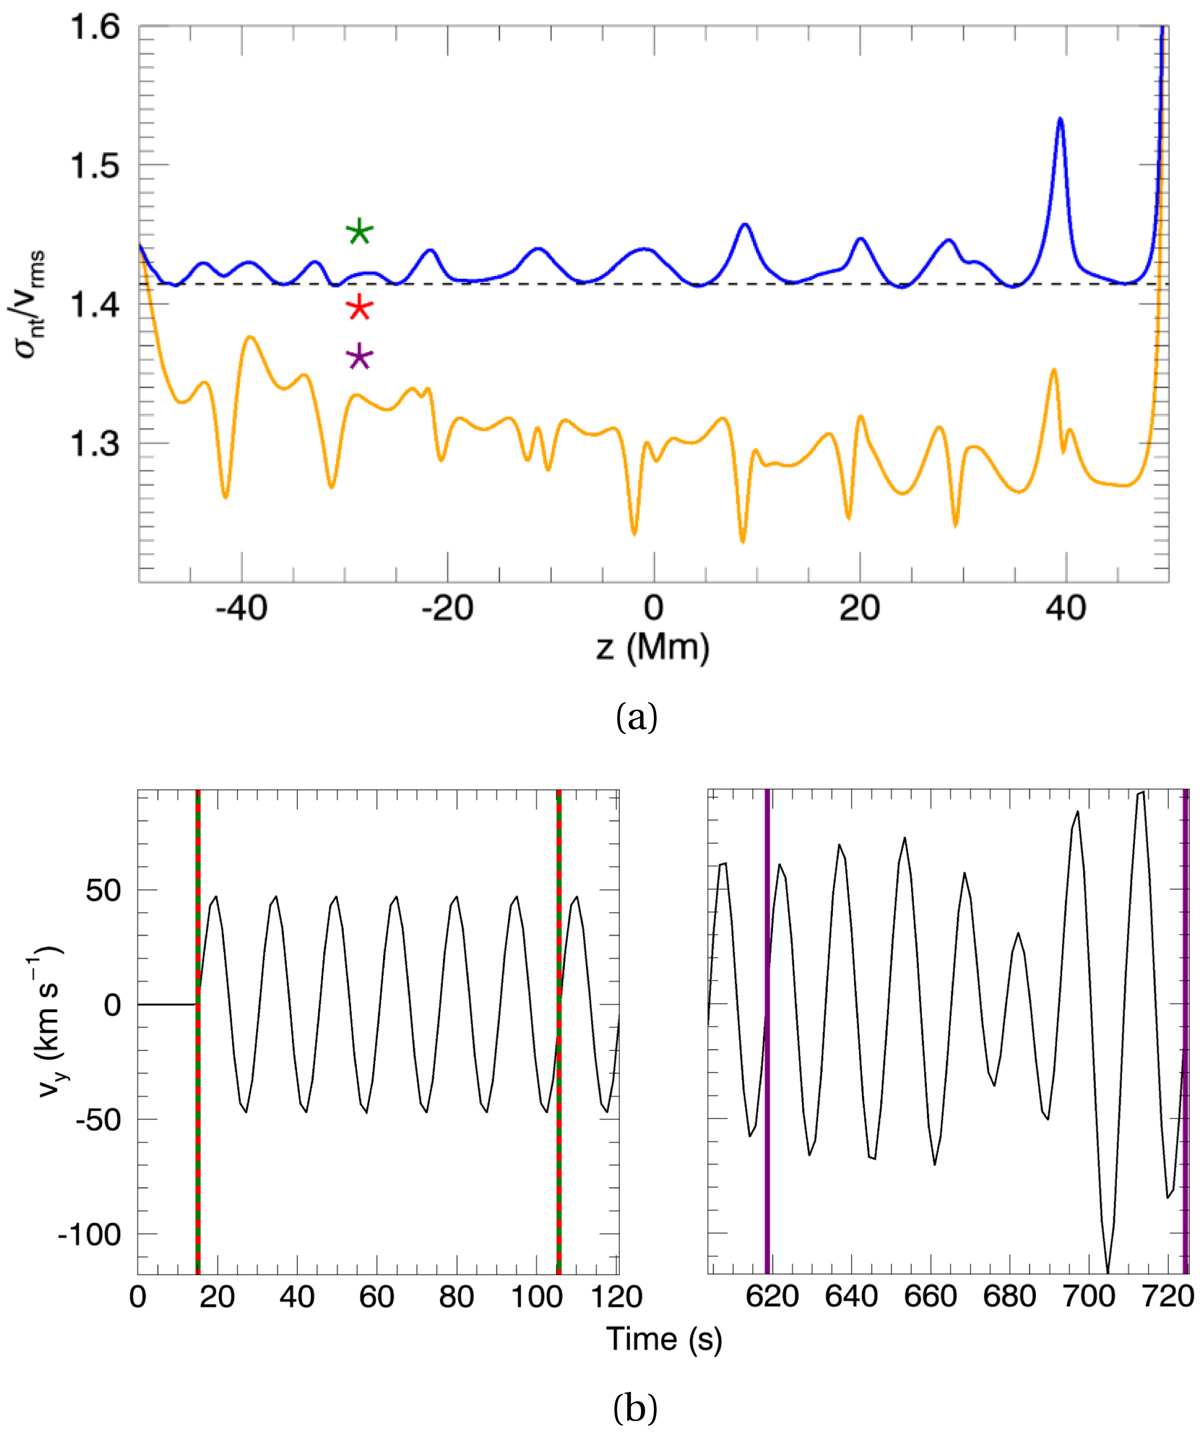
Analysis of σnt/vrms. (a) σnt/vrms as a function of height (z) for the vy : H simulation in the Alfvén wave model. The orange line has an exposure time equal to the period of the driver, and the blue line has an ‘infinite’ exposure time (full length of the simulation). The dashed horizontal line is at ![]() . The asterisks are evaluated at (x′,z) = (0.1, −28.6) Mm during a time frame before (green and red) and after (purple) wave reflection off the top boundary, with exposure times equal to one period (15 s: green and purple) and one and a half periods (22.5 s: red) of the velocity driver. (b) Time frames for the asterisks described in (a), depicted by the vertical bars (corresponding colours) on top of vy at the point (x′,y′,z) = (0.1, 0.1, −28.6) Mm as a function of the time (black line). Left and right-hand panels: are from approximately 0−120 s and 605−725 s, respectively.
. The asterisks are evaluated at (x′,z) = (0.1, −28.6) Mm during a time frame before (green and red) and after (purple) wave reflection off the top boundary, with exposure times equal to one period (15 s: green and purple) and one and a half periods (22.5 s: red) of the velocity driver. (b) Time frames for the asterisks described in (a), depicted by the vertical bars (corresponding colours) on top of vy at the point (x′,y′,z) = (0.1, 0.1, −28.6) Mm as a function of the time (black line). Left and right-hand panels: are from approximately 0−120 s and 605−725 s, respectively.
Current usage metrics show cumulative count of Article Views (full-text article views including HTML views, PDF and ePub downloads, according to the available data) and Abstracts Views on Vision4Press platform.
Data correspond to usage on the plateform after 2015. The current usage metrics is available 48-96 hours after online publication and is updated daily on week days.
Initial download of the metrics may take a while.