Fig. 11.
Download original image
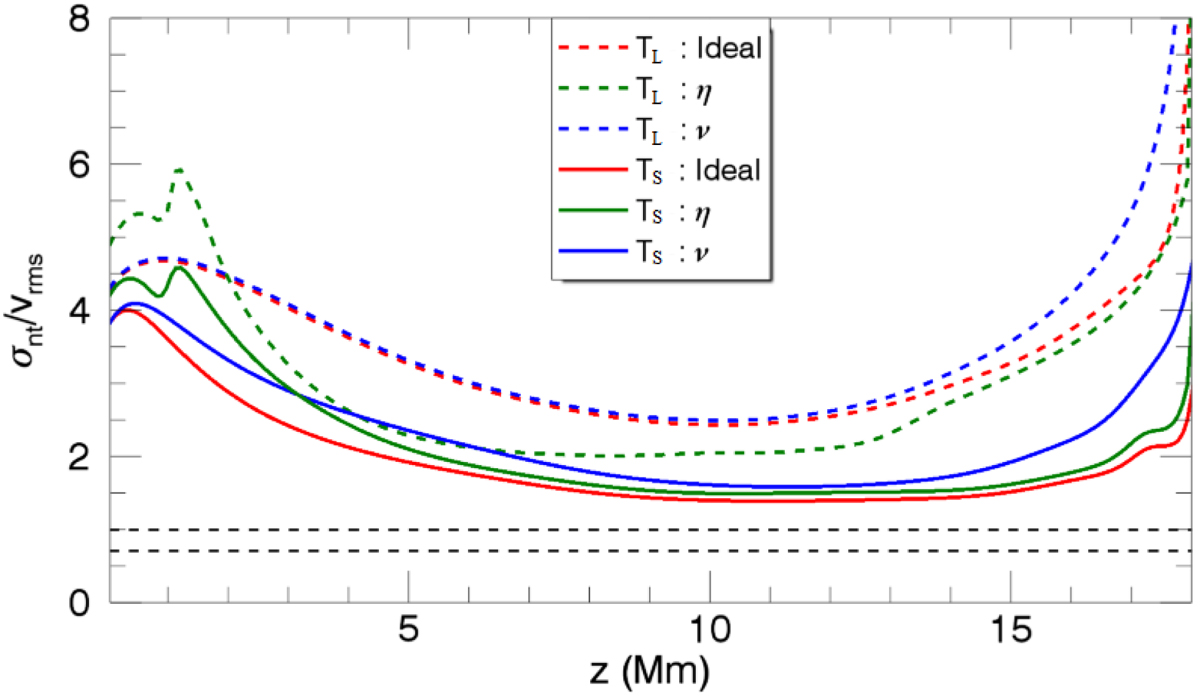
σnt/vrms as a function of height (z) for the arcade model with an exposure times of 29 s (similar for 261 s and 739 s). The different driving timescales are TL (coloured dashed lines) and TS (solid lines) with the ideal (red), resistive (green), and viscous (blue) regimes. The dashed horizontal lines, from top to bottom, are 1 and ![]() .
.
Current usage metrics show cumulative count of Article Views (full-text article views including HTML views, PDF and ePub downloads, according to the available data) and Abstracts Views on Vision4Press platform.
Data correspond to usage on the plateform after 2015. The current usage metrics is available 48-96 hours after online publication and is updated daily on week days.
Initial download of the metrics may take a while.