Free Access
Fig. 7.
Download original image
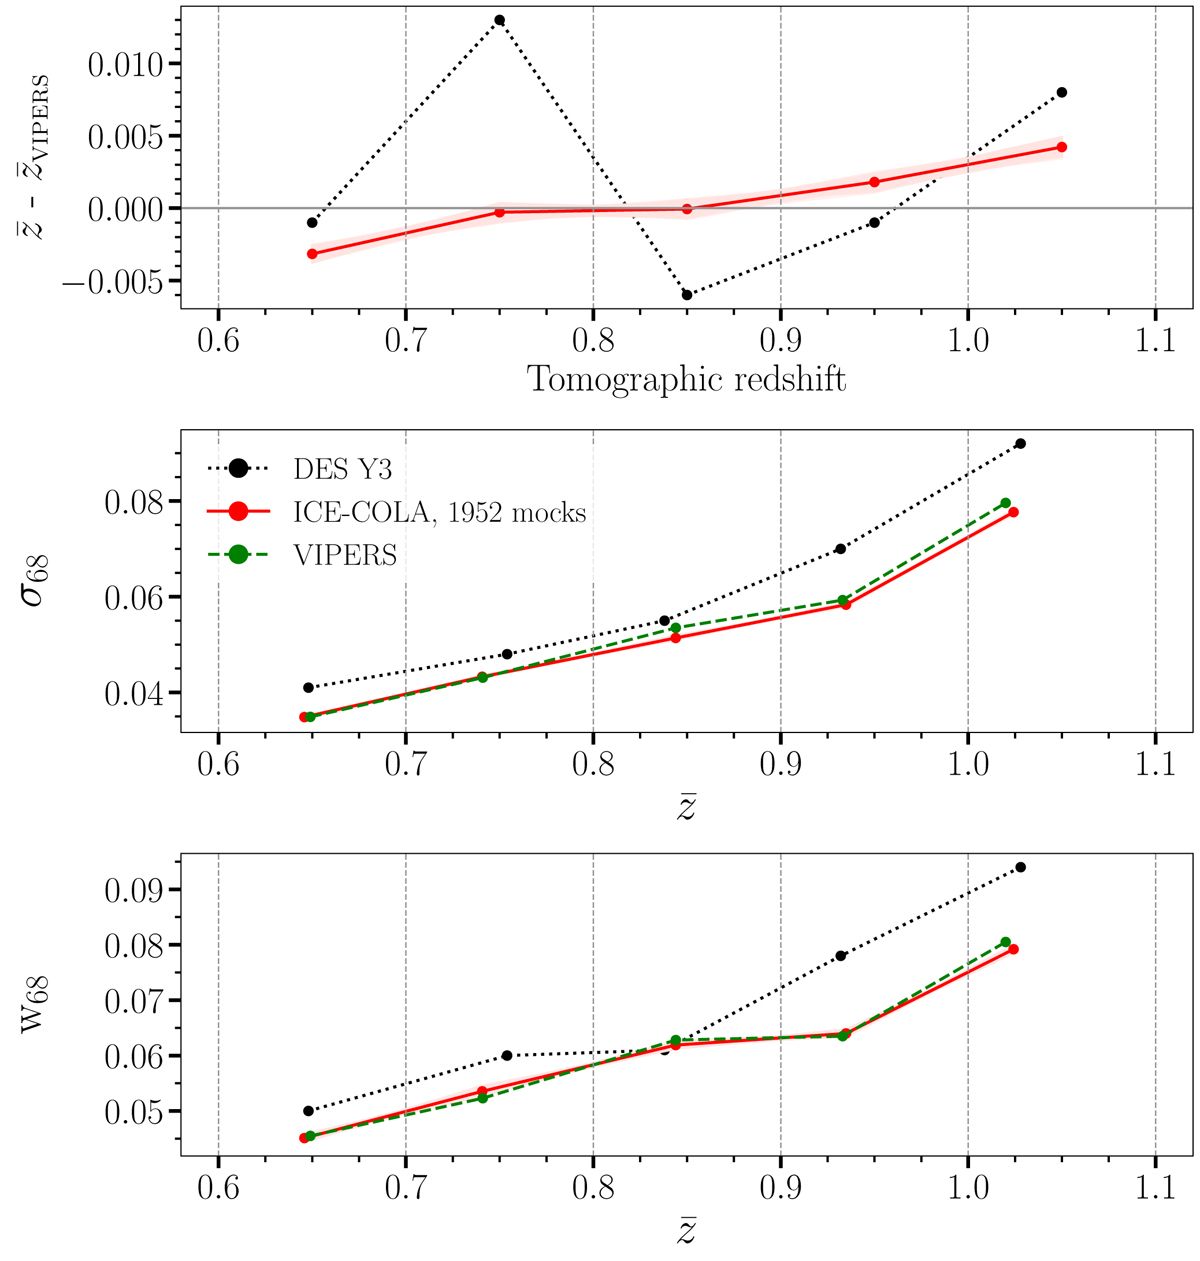
Basic metrics for the photo-z validation on each tomographic bin. From top to bottom: difference between ![]() and
and ![]() , evolution of σ68 and W68 as a function
, evolution of σ68 and W68 as a function ![]() . Black and red curves correspond to DES Y3 and ICE-COLA, respectively, and green lines on bottom panels represent VIPERS.
. Black and red curves correspond to DES Y3 and ICE-COLA, respectively, and green lines on bottom panels represent VIPERS.
Current usage metrics show cumulative count of Article Views (full-text article views including HTML views, PDF and ePub downloads, according to the available data) and Abstracts Views on Vision4Press platform.
Data correspond to usage on the plateform after 2015. The current usage metrics is available 48-96 hours after online publication and is updated daily on week days.
Initial download of the metrics may take a while.