Fig. 6.
Download original image
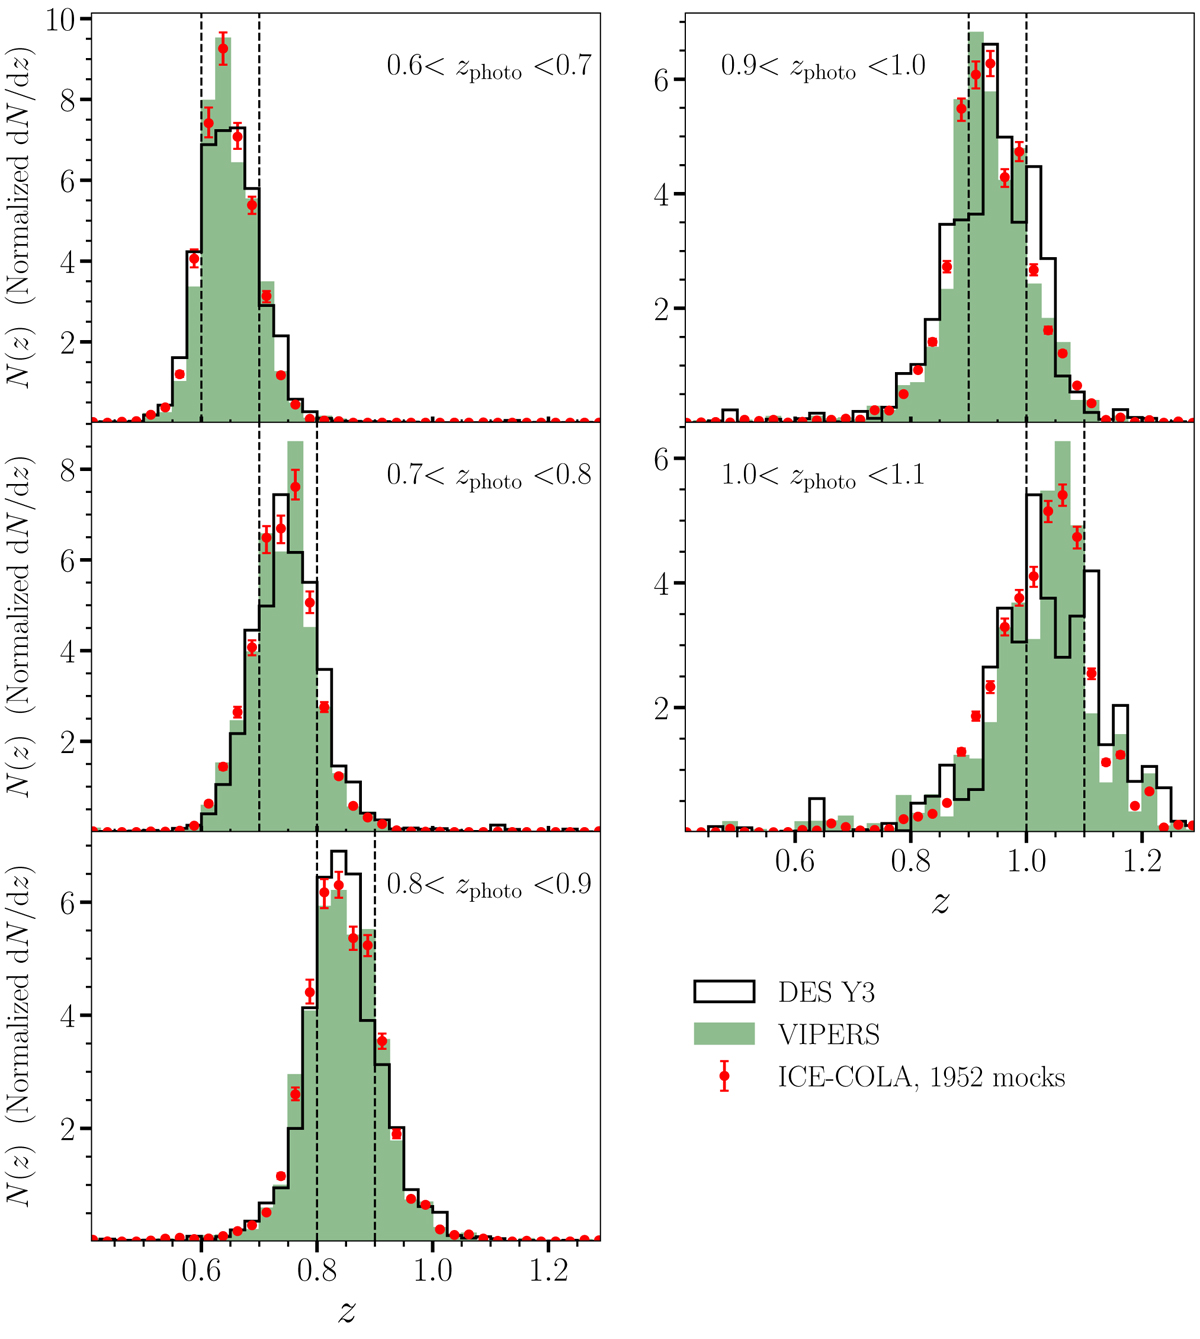
True redshift zspec distribution in each tomographic bin. Green filled histograms correspond to VIPERS, black lines represent the distribution for Y3 data and red point are the average over the 1952 ICE-COLA mocks, while error bars correspond to the maximum and minimum. Histograms are normalized to have an integral of unity.
Current usage metrics show cumulative count of Article Views (full-text article views including HTML views, PDF and ePub downloads, according to the available data) and Abstracts Views on Vision4Press platform.
Data correspond to usage on the plateform after 2015. The current usage metrics is available 48-96 hours after online publication and is updated daily on week days.
Initial download of the metrics may take a while.