Free Access
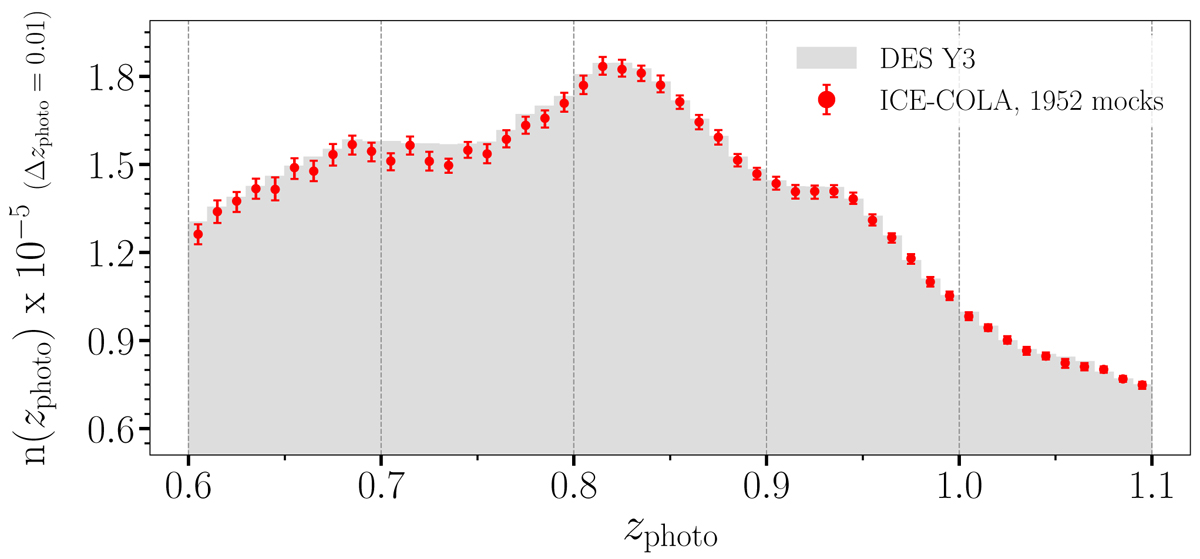
Fig. 5.
Download original image
Photometric redshift distribution of data and mocks. Gray histogram corresponds to DES Y3 sample. Red points represent the average over the 1952 ICE-COLA mocks and error bars denote the maximum and minimum.
Current usage metrics show cumulative count of Article Views (full-text article views including HTML views, PDF and ePub downloads, according to the available data) and Abstracts Views on Vision4Press platform.
Data correspond to usage on the plateform after 2015. The current usage metrics is available 48-96 hours after online publication and is updated daily on week days.
Initial download of the metrics may take a while.