Free Access
Fig. 2.
Download original image
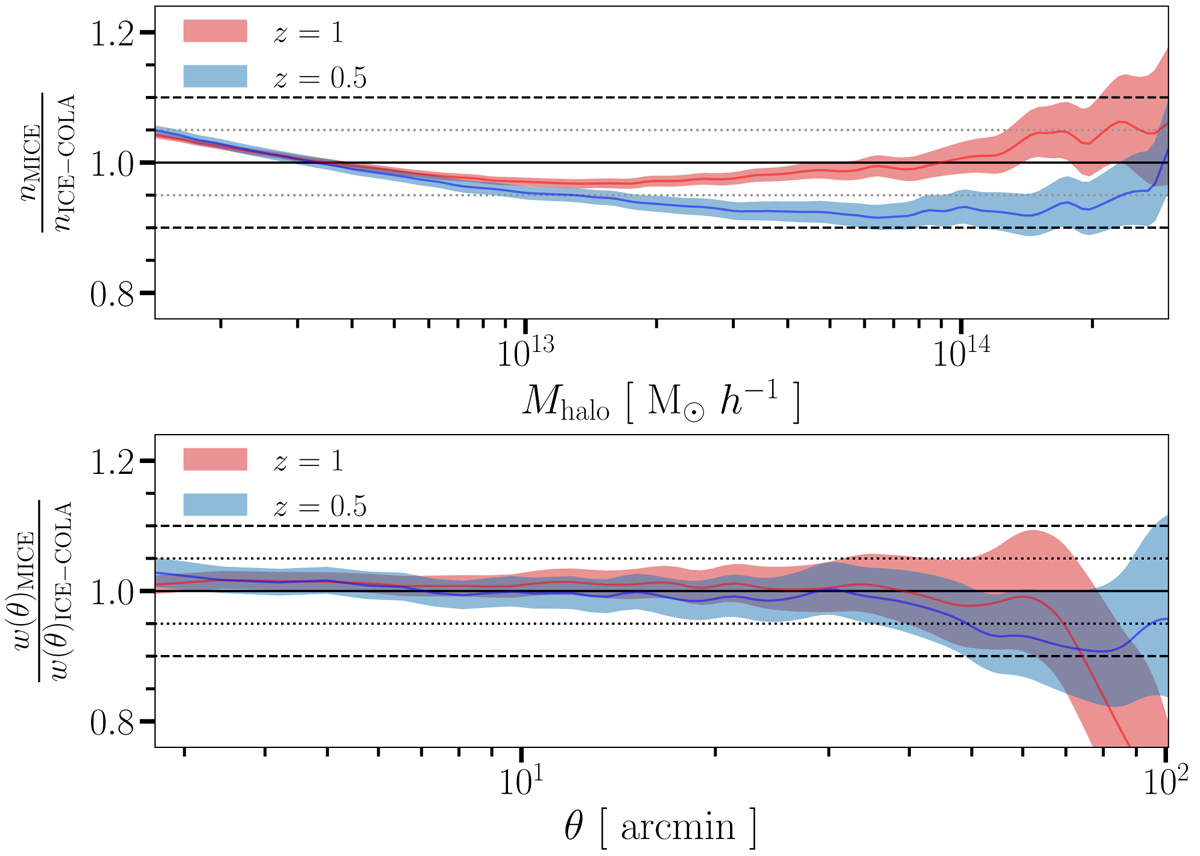
Top panel: ratio of the Halo Mass Function between MICE and ICE-COLA. Blue for redshift z = 0.5 and red for z = 1. Shaded areas correspond to the standar deviation of the 488 ICE-COLA runs. Bottom panel: ratio between the MICE and the ICE-COLA ACF for a sample of halos with Mhalo > 1.46 × 10¹² M⊙.
Current usage metrics show cumulative count of Article Views (full-text article views including HTML views, PDF and ePub downloads, according to the available data) and Abstracts Views on Vision4Press platform.
Data correspond to usage on the plateform after 2015. The current usage metrics is available 48-96 hours after online publication and is updated daily on week days.
Initial download of the metrics may take a while.