Free Access
Fig. 13.
Download original image
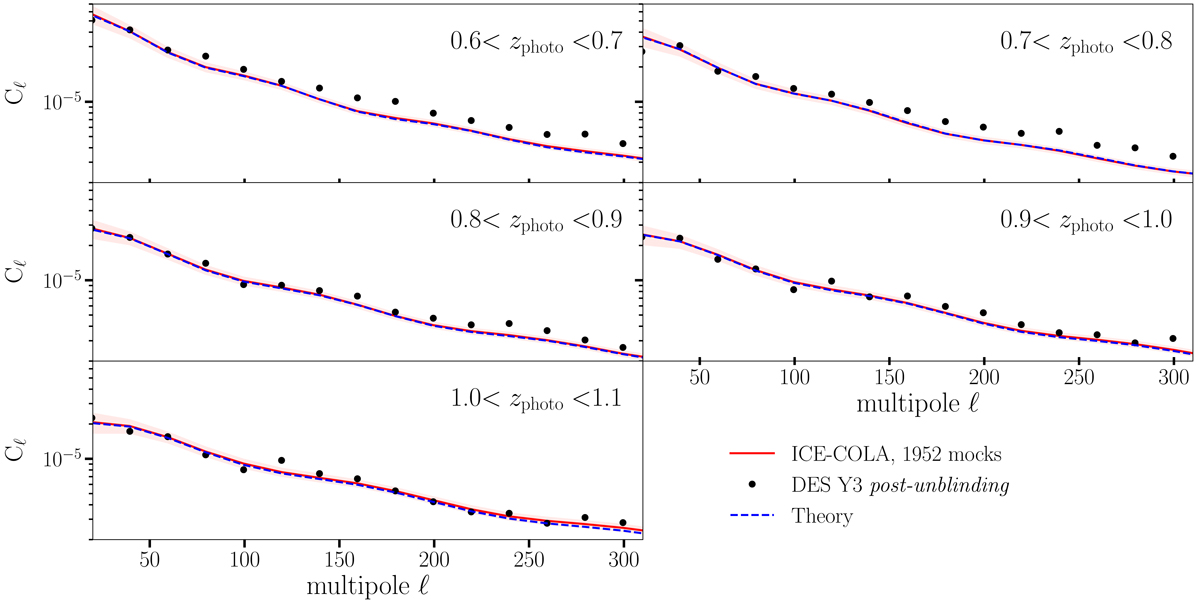
Measured angular power spectra for the tomographic redshift bins considered. Red lines correspond to the average over all the mocks and black points represent the post-unblinding measurements of the data. The theoretical prediction is shown with dashed blue lines.
Current usage metrics show cumulative count of Article Views (full-text article views including HTML views, PDF and ePub downloads, according to the available data) and Abstracts Views on Vision4Press platform.
Data correspond to usage on the plateform after 2015. The current usage metrics is available 48-96 hours after online publication and is updated daily on week days.
Initial download of the metrics may take a while.