Free Access
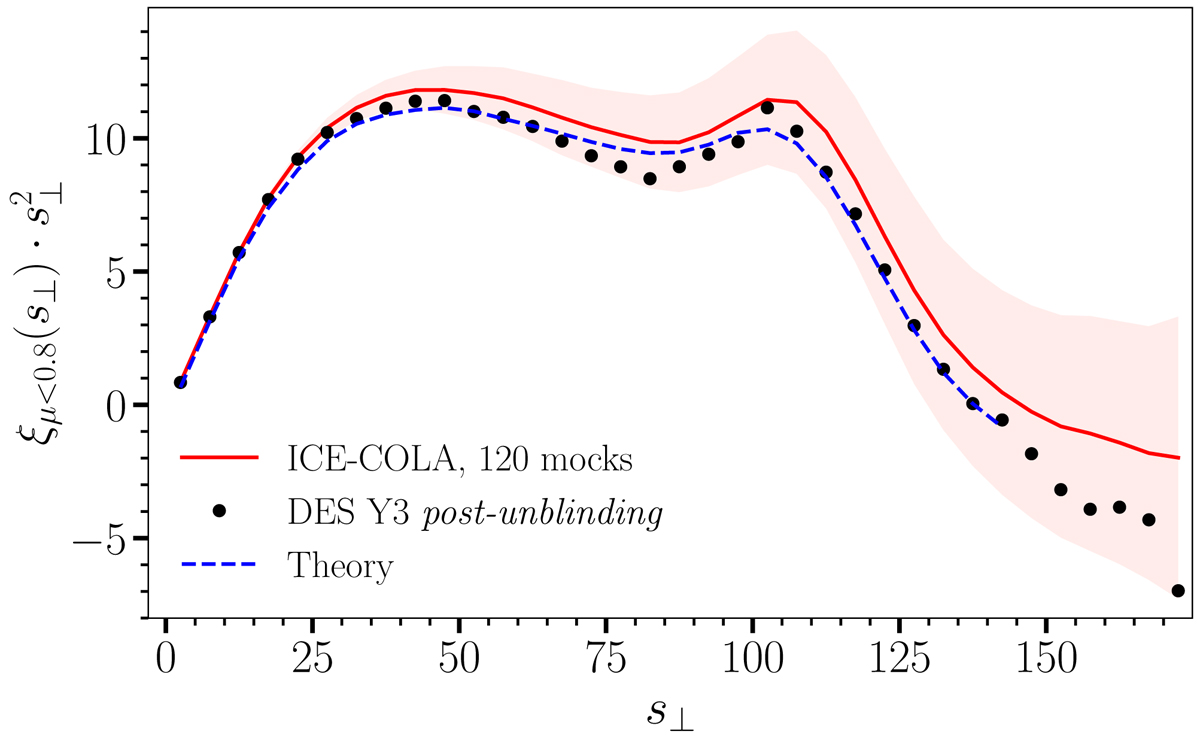
Fig. 12.
Download original image
3D wedge correlation function for μ range [0, 0.8]. With the same color code as previous figures, solid red line corresponds to ICE-COLA mocks and shaded light-red band to its standard deviation. Post-unblinding measurement of data is shown with black points and the theory with a dashed blue line.
Current usage metrics show cumulative count of Article Views (full-text article views including HTML views, PDF and ePub downloads, according to the available data) and Abstracts Views on Vision4Press platform.
Data correspond to usage on the plateform after 2015. The current usage metrics is available 48-96 hours after online publication and is updated daily on week days.
Initial download of the metrics may take a while.