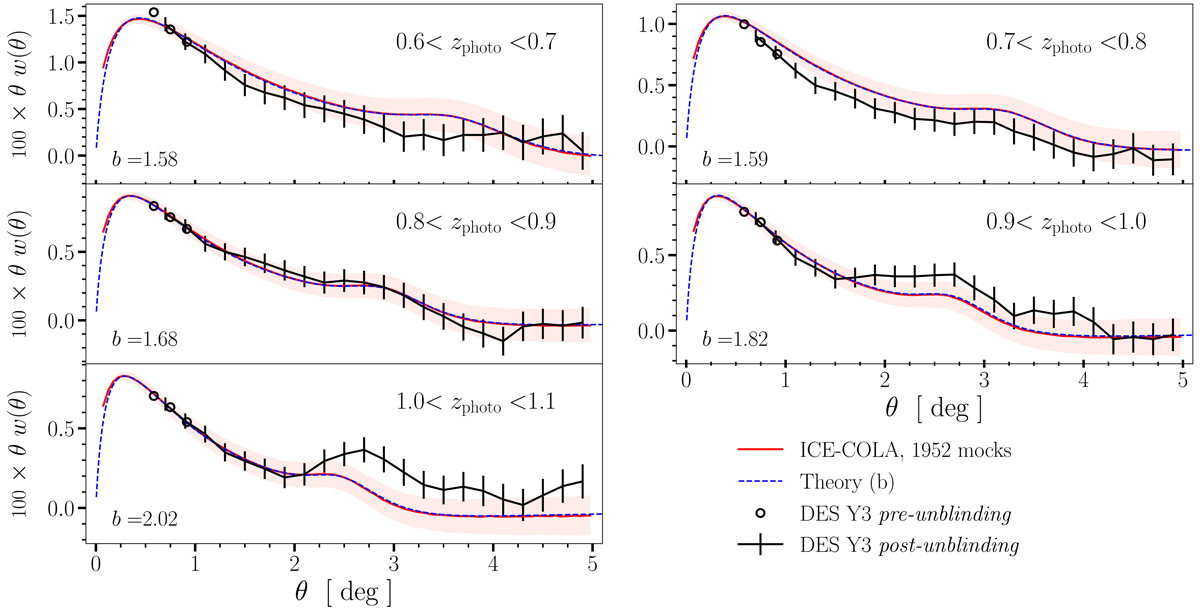
Fig. 11.
Download original image
Angular two-point correlation function for each tomographic bin. Red lines correspond to the average over all the mocks and shaded light-red bands correspond to the standard deviation. Dashed blue lines indicate the theoretical prediction described on Sect. 6.1 and black points correspond to the pre-unblinding data values used in the calibration showed on Sect. 5. Finally, solid black lines with error bars represent the final post-unblinding measurement of the data.
Current usage metrics show cumulative count of Article Views (full-text article views including HTML views, PDF and ePub downloads, according to the available data) and Abstracts Views on Vision4Press platform.
Data correspond to usage on the plateform after 2015. The current usage metrics is available 48-96 hours after online publication and is updated daily on week days.
Initial download of the metrics may take a while.