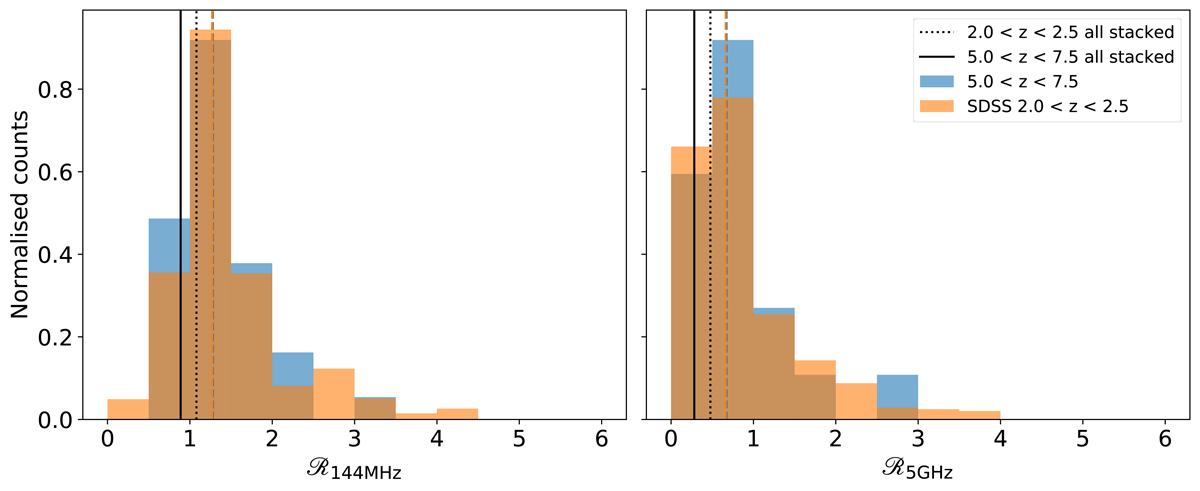
Fig. 8.
Download original image
Normalised radio loudness distribution of only the LOFAR detected high-z quasar sample (blue, 38 sources) and a magnitude matched sample of LOFAR detected SDSS quasars between 2.0 < z < 2.5 (orange) using Eq. (2) (left) and Eq. (3) (right). The low-z sample (3800 sources) is created by magnitude matching with the high-z sample (see Sect. 4), to ensure an equal underlying optical magnitude distribution. The coloured dashed lines indicate the median of the distributions. In the left panel these values are almost equal, causing the blue and orange dashed lines to almost overlap. The solid and dotted black line indicate the median radio loudness resulting from stacking all high-z quasars and matched low-z quasars, respectively.
Current usage metrics show cumulative count of Article Views (full-text article views including HTML views, PDF and ePub downloads, according to the available data) and Abstracts Views on Vision4Press platform.
Data correspond to usage on the plateform after 2015. The current usage metrics is available 48-96 hours after online publication and is updated daily on week days.
Initial download of the metrics may take a while.