Fig. 4.
Download original image
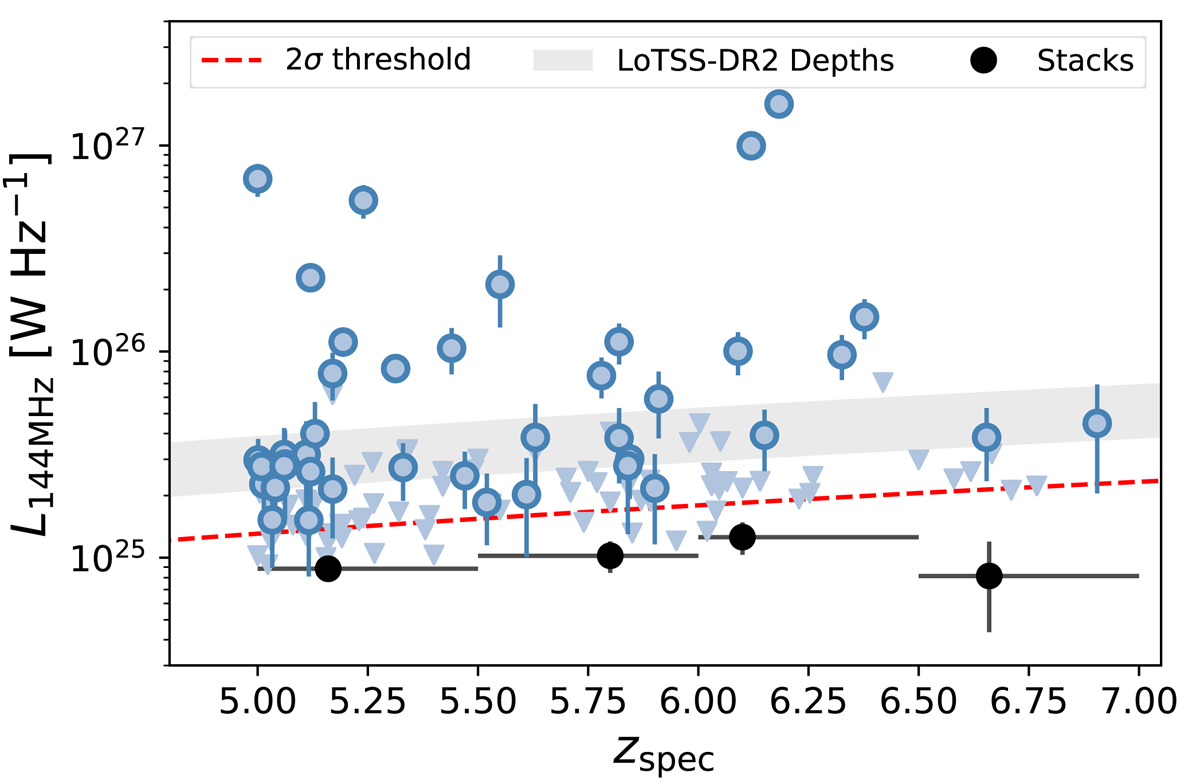
Radio luminosity of high-z quasars at 144 MHz as a function of their redshift. The grey band indicates the 5σ detection limit range of LoTSS-DR2 (16th to 84th percentile) and the filled blue circles are quasar detections at a > 2σ level. The triangles indicate 2σ upper limits for quasars with < 2σ detection. The black circles show the median stacked radio luminosity when stacking all quasars in redshift bins from z = 5 to 7.0 in steps 0.5. The average 2σ threshold is given by the red dashed line.
Current usage metrics show cumulative count of Article Views (full-text article views including HTML views, PDF and ePub downloads, according to the available data) and Abstracts Views on Vision4Press platform.
Data correspond to usage on the plateform after 2015. The current usage metrics is available 48-96 hours after online publication and is updated daily on week days.
Initial download of the metrics may take a while.