Fig. 3.
Download original image
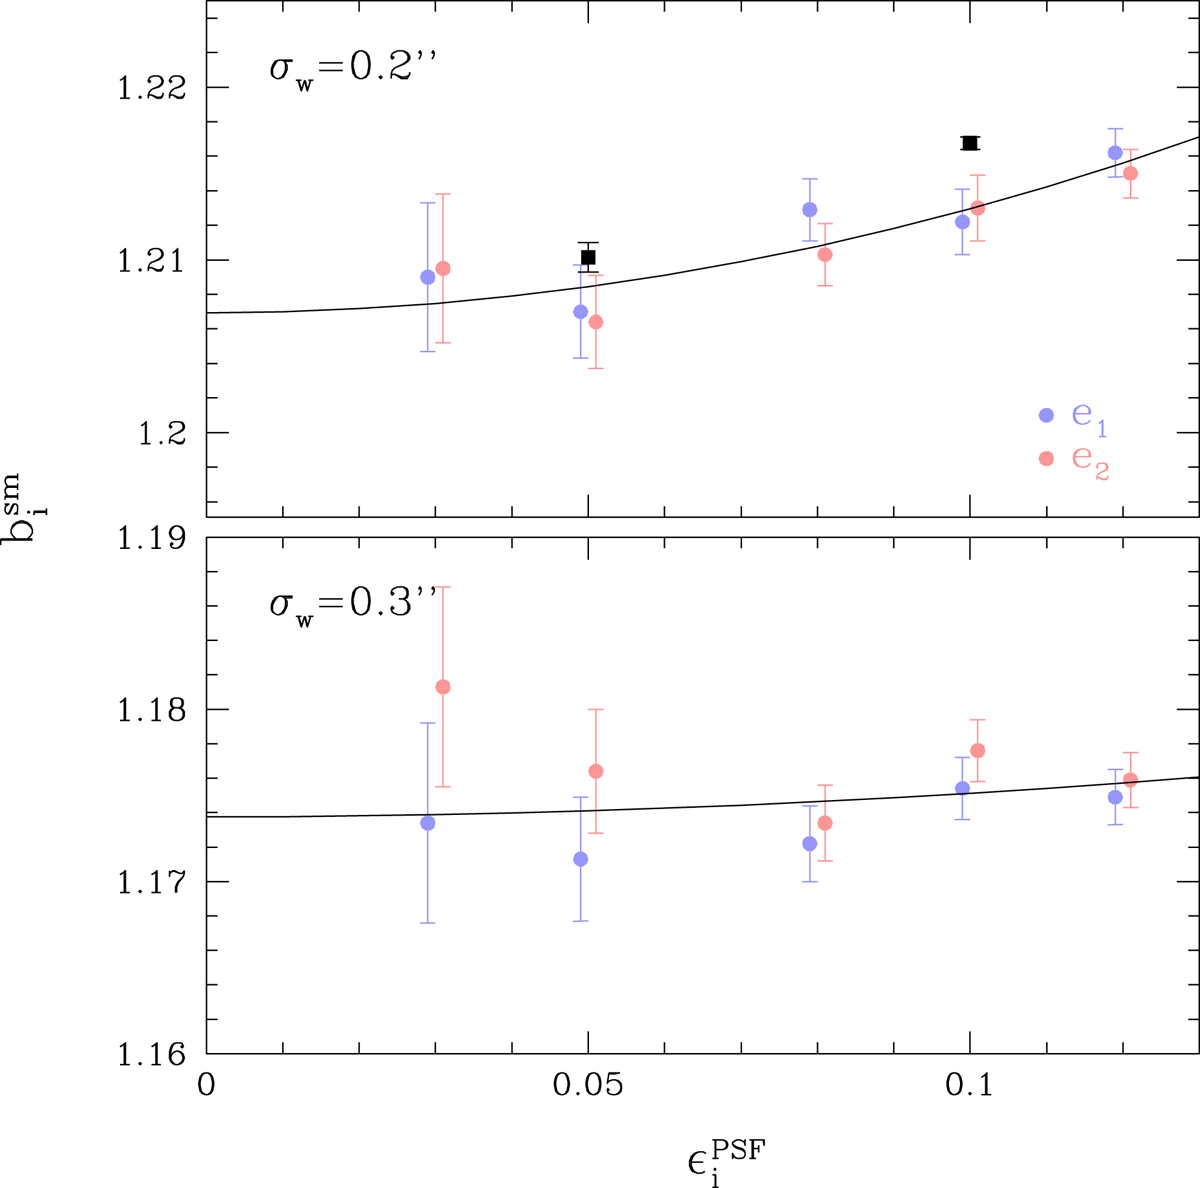
Correction factor ![]() as a function of PSF ellipticity for a weight function
as a function of PSF ellipticity for a weight function ![]() (top) and
(top) and ![]() (bottom). The red and blue points show the results for the individual shear components using the grid-based simulations. The lines are the best-fit model (see text) to both components jointly. The bias is smaller overall for the larger weight function, whilst the dependence with PSF ellipticity is also reduced. The black squares in the top panel correspond to our baseline setup, with galaxies placed randomly. This suggests that blending has a small impact on the correction.
(bottom). The red and blue points show the results for the individual shear components using the grid-based simulations. The lines are the best-fit model (see text) to both components jointly. The bias is smaller overall for the larger weight function, whilst the dependence with PSF ellipticity is also reduced. The black squares in the top panel correspond to our baseline setup, with galaxies placed randomly. This suggests that blending has a small impact on the correction.
Current usage metrics show cumulative count of Article Views (full-text article views including HTML views, PDF and ePub downloads, according to the available data) and Abstracts Views on Vision4Press platform.
Data correspond to usage on the plateform after 2015. The current usage metrics is available 48-96 hours after online publication and is updated daily on week days.
Initial download of the metrics may take a while.