Fig. 2.
Download original image
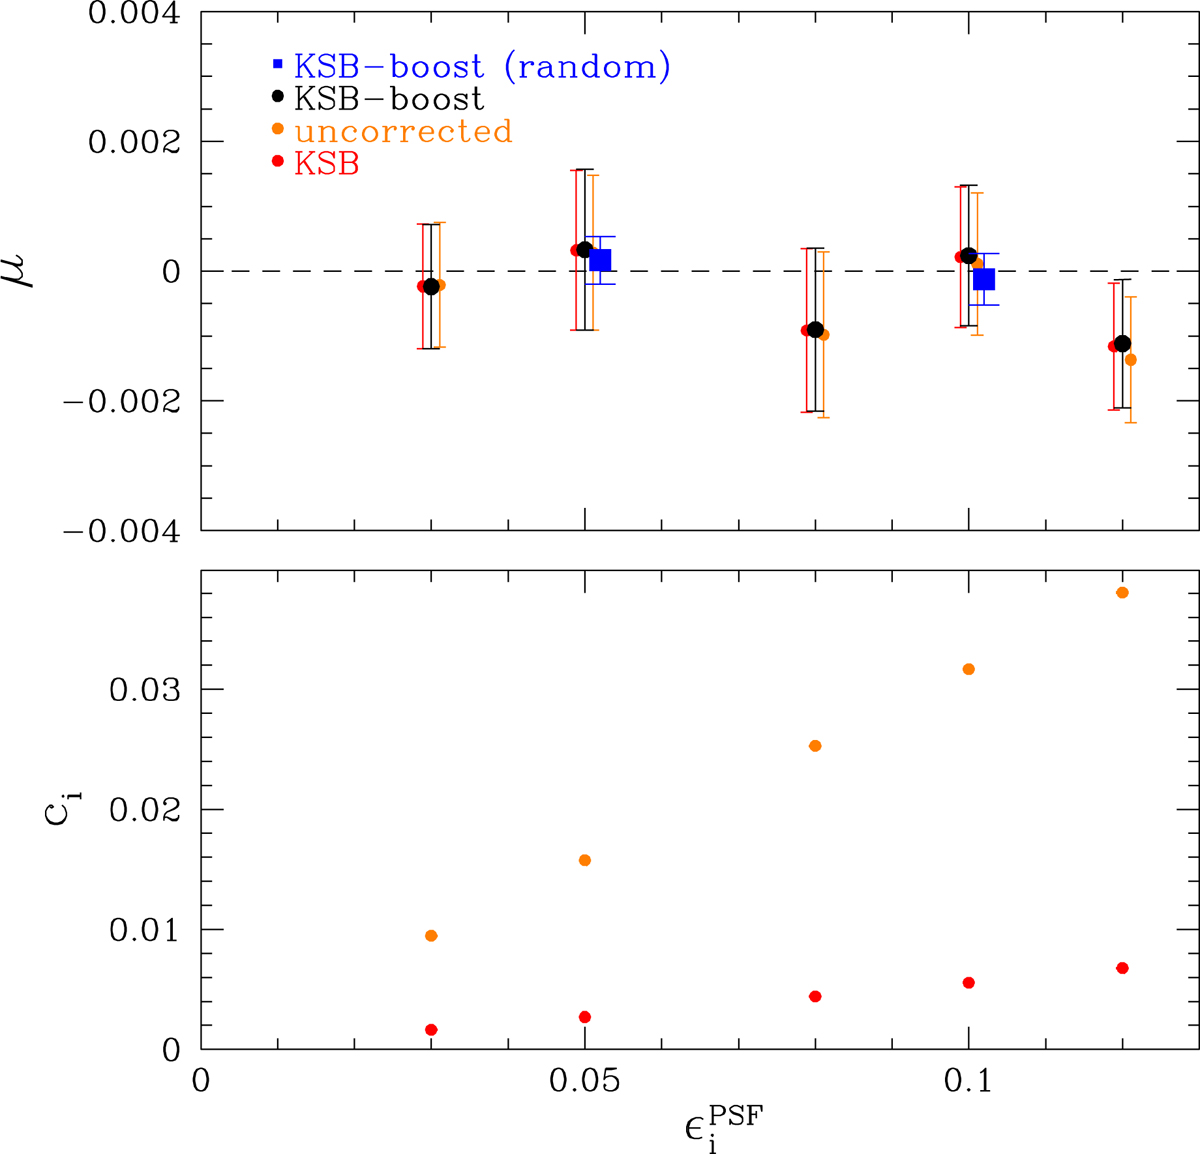
Multiplicative bias, μ (top) and additive bias, ci (bottom) after METADETECTION, as a function of PSF ellipticity, ![]() , for galaxies with 20 < mVIS < 24.5 that were placed on a grid. The orange points correspond to the results without correction for PSF anisotropy, whereas the red points indicate the biases after the nominal KSB correction (bsm = 1). The black points show the results using the value for bsm that nulls the additive bias for the grid-based simulations, whereas the blue squares correspond to our baseline setup, where galaxies were placed randomly (see Sect. 4.2; in this case the error bars are smaller, because we simulated more images for the baseline case). We do not show the corresponding additive biases, because those are consistent with zero by construction.
, for galaxies with 20 < mVIS < 24.5 that were placed on a grid. The orange points correspond to the results without correction for PSF anisotropy, whereas the red points indicate the biases after the nominal KSB correction (bsm = 1). The black points show the results using the value for bsm that nulls the additive bias for the grid-based simulations, whereas the blue squares correspond to our baseline setup, where galaxies were placed randomly (see Sect. 4.2; in this case the error bars are smaller, because we simulated more images for the baseline case). We do not show the corresponding additive biases, because those are consistent with zero by construction.
Current usage metrics show cumulative count of Article Views (full-text article views including HTML views, PDF and ePub downloads, according to the available data) and Abstracts Views on Vision4Press platform.
Data correspond to usage on the plateform after 2015. The current usage metrics is available 48-96 hours after online publication and is updated daily on week days.
Initial download of the metrics may take a while.