Fig. 9.
Download original image
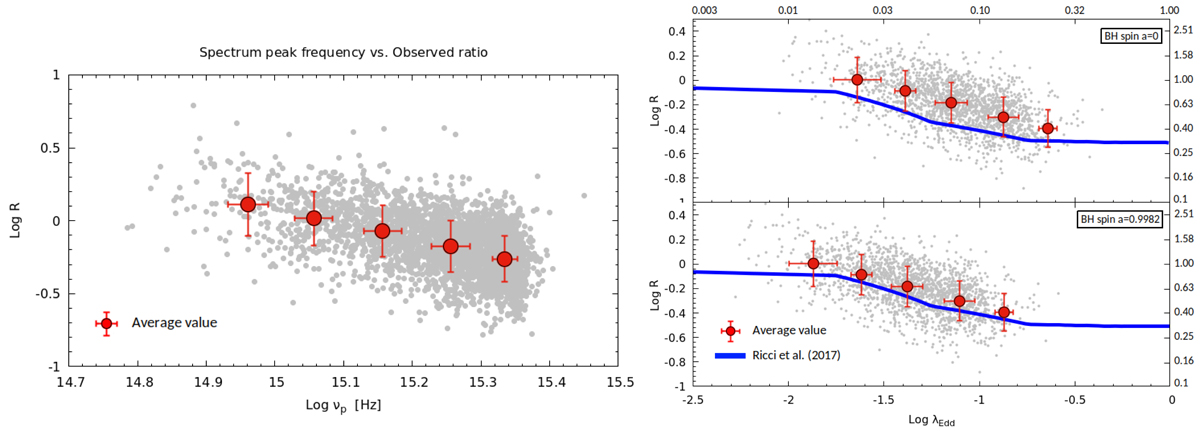
Left panel: luminosity ratio R as a function of the spectrum peak frequency νp. Right panel: luminosity ratio R as a function of the Eddington ratio λEdd assuming nonspinning (top panel) and maximally spinning SMBHs (bottom panel) for a fixed θv = 30° (sharing the same x-axis). The gray dots represent the SDSS sample. The thick blue lines in the right panels represent the results of Ricci et al. (2017) (their Fig. 4, assuming the covering factor ≈ luminosity ratio R; see text). On both plots, red dots represent the average values of R computed at fixed frequency and Eddington ratio bins (with 1σ error bars). The top x-axis and side y-axis show the linear value of λEdd and R, respectively.
Current usage metrics show cumulative count of Article Views (full-text article views including HTML views, PDF and ePub downloads, according to the available data) and Abstracts Views on Vision4Press platform.
Data correspond to usage on the plateform after 2015. The current usage metrics is available 48-96 hours after online publication and is updated daily on week days.
Initial download of the metrics may take a while.