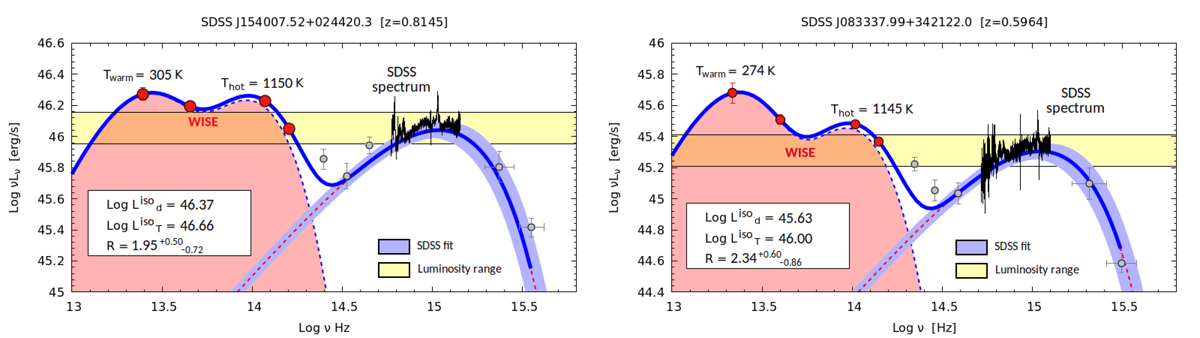
Fig. 8.
Download original image
Fit of two sources with a large luminosity ratio that cannot be explained with the KERRBB radiation pattern. The SDSS spectrum (black line) continuum is described with KERRBB (dashed red line, with a shaded blue area representing a confidence interval given by the uncertainty on the spectrum peak; see Sect. 4.1) while the torus emission is constrained with the four WISE data points (red dots) and two black bodies (shaded red area with a dashed blue line contour) plotted along with the corresponding temperatures. The thick blue line is the overall model (disk + torus). On each plot, we report the isotropic disk and torus luminosities (in erg s−1) and the luminosity ratio R along with its uncertainty (see Sect. 5.3). Some archival photometric data (2MASS, NED, GALEX – gray dots) are added to both plots. The yellow shaded area is the luminosity range in which νpLνp lies, obtained by taking into account different uncertainties (Sect. 5.3).
Current usage metrics show cumulative count of Article Views (full-text article views including HTML views, PDF and ePub downloads, according to the available data) and Abstracts Views on Vision4Press platform.
Data correspond to usage on the plateform after 2015. The current usage metrics is available 48-96 hours after online publication and is updated daily on week days.
Initial download of the metrics may take a while.