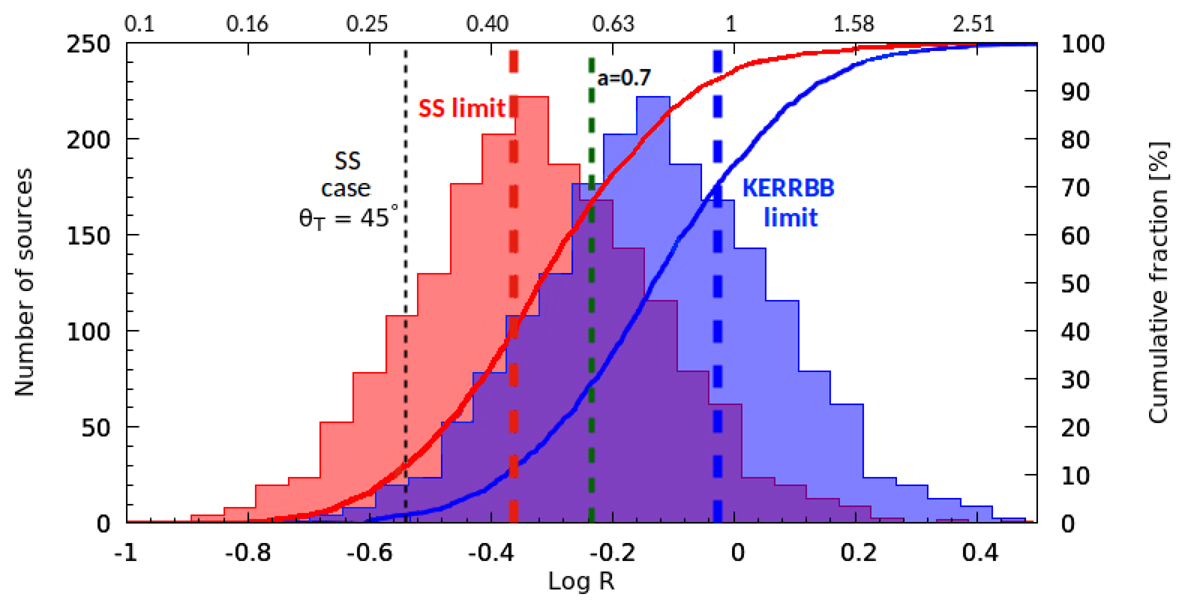
Fig. 7.
Download original image
Logarithmic distribution of the luminosity ratio R (blue histogram; mean logarithmic value ⟨Log R⟩= − 0.13 ± 0.20). The red histogram is the distribution assuming that R is given by its lower limit (from uncertainties – see Sect. 5.3). The solid blue and red lines are the cumulative functions related to the two histograms. The thick dashed blue line is the KERRBB limit (R = 0.94, for θv = 30°) while the maximum SS value (R = 0.43, for θv = 30°) is represented with a dashed red line (the thin dashed black line represents the SS case with θT = 45° and θv = 30°). Sources whose luminosity ratio R is larger than the one shown with a dashed green line have a BH spin a > 0.7 (see Sect. 2). The top x-axis shows the linear value of R.
Current usage metrics show cumulative count of Article Views (full-text article views including HTML views, PDF and ePub downloads, according to the available data) and Abstracts Views on Vision4Press platform.
Data correspond to usage on the plateform after 2015. The current usage metrics is available 48-96 hours after online publication and is updated daily on week days.
Initial download of the metrics may take a while.