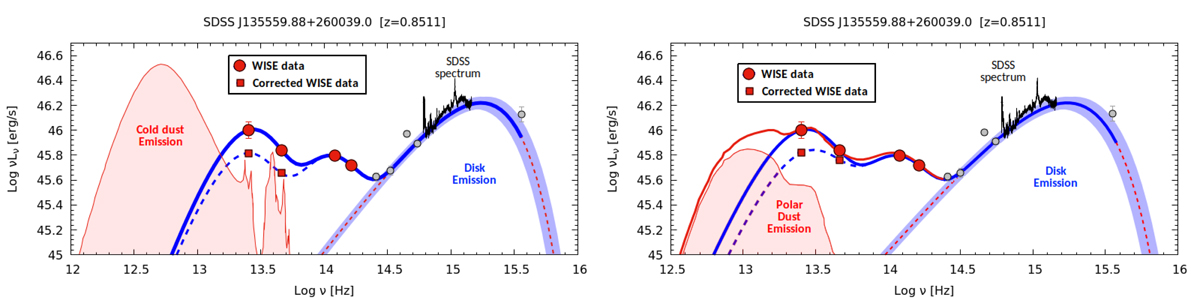
Fig. 6.
Download original image
Example of flux correction from cold dust (left panel) and polar dust (right panel) of the WISE data. We used the template of the starburst galaxy M 82 (Kennicutt et al. 2003, red line) assuming a peak luminosity twice larger than the AD one (described by KERRBB, dashed red line in both panels) and the mean polar dust template as found by Lyu & Rieke (2018), assuming that its contribution to the MIR emission is ∼50% (as found by Asmus et al. 2016 and Lyu & Rieke 2018). The thick blue line is the disk–torus model related to the uncorrected WISE data and the SDSS spectrum (black line). The dashed blue line is the new fit performed after the correction of the WISE data flux from the contamination. For the cold dust, the uncorrected and corrected luminosity ratios are R = 0.55 and R = 0.44, respectively; for the polar dust, R = 0.55 and R = 0.39, respectively. Some archival photometric data (2MASS, NED, GALEX) are plotted with gray dots (not used in the fitting process).
Current usage metrics show cumulative count of Article Views (full-text article views including HTML views, PDF and ePub downloads, according to the available data) and Abstracts Views on Vision4Press platform.
Data correspond to usage on the plateform after 2015. The current usage metrics is available 48-96 hours after online publication and is updated daily on week days.
Initial download of the metrics may take a while.