Fig. 5.
Download original image
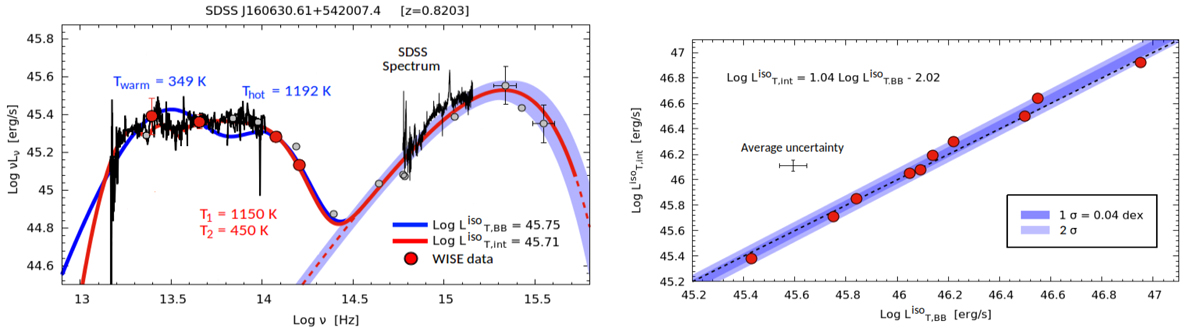
Left panel: example of fit of the SDSS optical – UV and Spitzer IR spectra (black lines). The thick blue line is the fit performed with two black-bodies (whose temperatures, Twarm and Thot, are reported in the plot) using the four WISE data points (red points) for the IR emission, and KERRBB for the disk emission (dashed red line with a shaded blue area representing the confidence interval for the spectrum peak – ∼0.05 dex). The thick red line is the fit performed with two parabolas and two black-bodies (whose temperatures, T1 and T2, are reported on the plot; see text for details) to describe the Spitzer emission, and KERRBB for the disk emission. Both the integrated luminosities (![]() and
and ![]() ) are reported on the plot (in erg s−1). Archival photometric data (2MASS, NED, GALEX) are shown with gray dots. Right panel: comparison between
) are reported on the plot (in erg s−1). Archival photometric data (2MASS, NED, GALEX) are shown with gray dots. Right panel: comparison between ![]() and
and ![]() for the sources with Spitzer IR data. The average uncertainty from the fit is shown in the plot. The best-fit equation is reported along with the 1–2σ data dispersion (shaded blue areas) and the 1:1 line (dashed black line).
for the sources with Spitzer IR data. The average uncertainty from the fit is shown in the plot. The best-fit equation is reported along with the 1–2σ data dispersion (shaded blue areas) and the 1:1 line (dashed black line).
Current usage metrics show cumulative count of Article Views (full-text article views including HTML views, PDF and ePub downloads, according to the available data) and Abstracts Views on Vision4Press platform.
Data correspond to usage on the plateform after 2015. The current usage metrics is available 48-96 hours after online publication and is updated daily on week days.
Initial download of the metrics may take a while.