Fig. 4.
Download original image
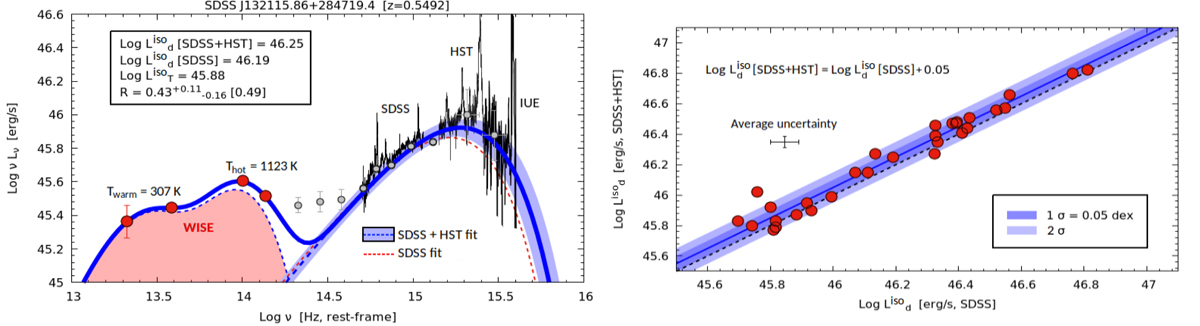
Left panel: example of the fit of the composite SDSS+HST+IUE spectrum (black lines) for one of the sources of the SDSS+HST sample. The disk emission is modeled with KERRBB (dashed blue line), compared with the fit performed only with the SDSS spectrum (dashed red line). The shaded blue area is a confidence interval of ∼0.05 dex on the spectrum peak. The luminosities inferred from both the fits are reported on the plot (in erg s−1) along with the luminosity ratio R (the value computed by considering only the SDSS spectrum is reported n brackets). The fit of the four WISE data points (red dots) is performed with two black bodies (shaded red area with a dashed line contour) plotted along with the corresponding temperatures. The thick blue line is the overall model (disk + torus). Some archival photometric data (2MASS, NED, GALEX – gray dots) are added to the plot (not used in the fitting process). Right panel: comparison between the isotropic disk luminosities computed from the fit of the SDSS spectrum alone and those computed using additional HST data. The average uncertainty from the fit is shown in the plot. The best-fit relation (blue line) is reported with the 1–2σ data dispersion (shown with shaded blue areas) and the 1:1 line (dashed black line).
Current usage metrics show cumulative count of Article Views (full-text article views including HTML views, PDF and ePub downloads, according to the available data) and Abstracts Views on Vision4Press platform.
Data correspond to usage on the plateform after 2015. The current usage metrics is available 48-96 hours after online publication and is updated daily on week days.
Initial download of the metrics may take a while.