Fig. 3.
Download original image
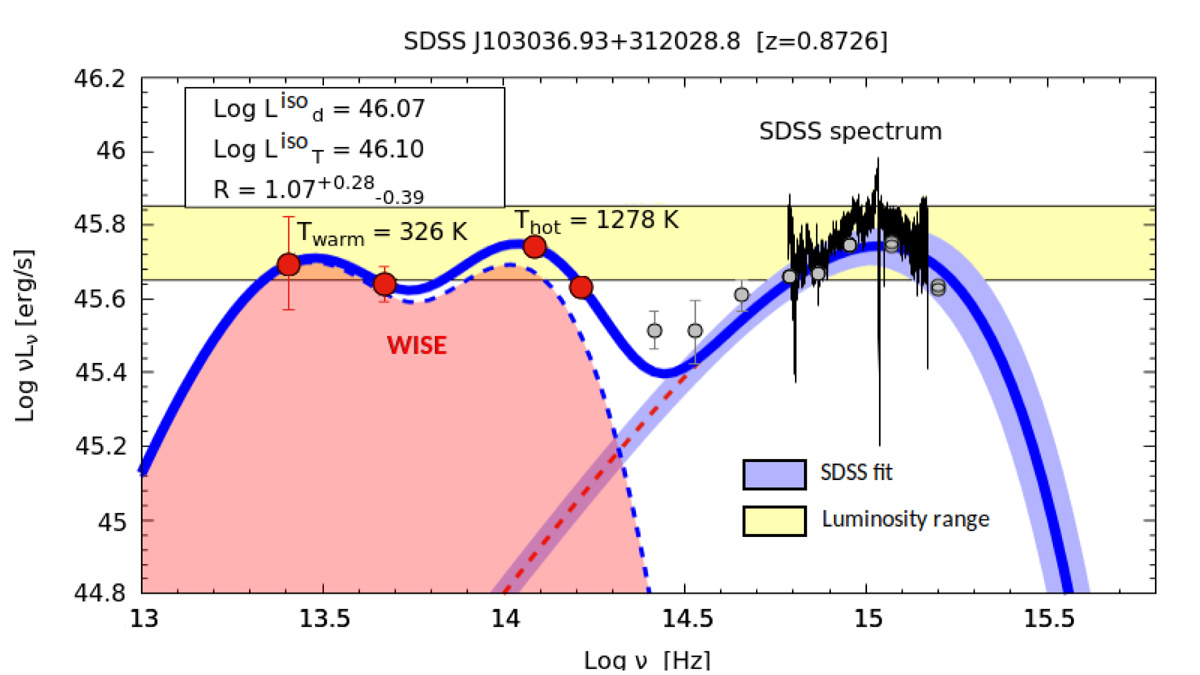
Example of SED modeling. The SDSS spectrum (black line) continuum is described with the KERRBB model (dashed red line) while the torus emission is constrained using the four WISE data points (red dots) and two black bodies (dashed blue line contour) plotted along with the corresponding temperatures. The thick blue line is the overall model (disk + torus). We report the isotropic disk and torus luminosities (in erg s−1) and the luminosity ratio R. Some archival photometric data (2MASS, NED, GALEX – gray dots) are added to the plot. The yellow shaded area is the luminosity range in which νpLνp lies, which is obtained whilst taking into account different uncertainties. For details about the fitting procedure, the uncertainties, and the constraints on θT and a, see Sects. 4 and 5.
Current usage metrics show cumulative count of Article Views (full-text article views including HTML views, PDF and ePub downloads, according to the available data) and Abstracts Views on Vision4Press platform.
Data correspond to usage on the plateform after 2015. The current usage metrics is available 48-96 hours after online publication and is updated daily on week days.
Initial download of the metrics may take a while.