Open Access
Fig. B.1
Download original image
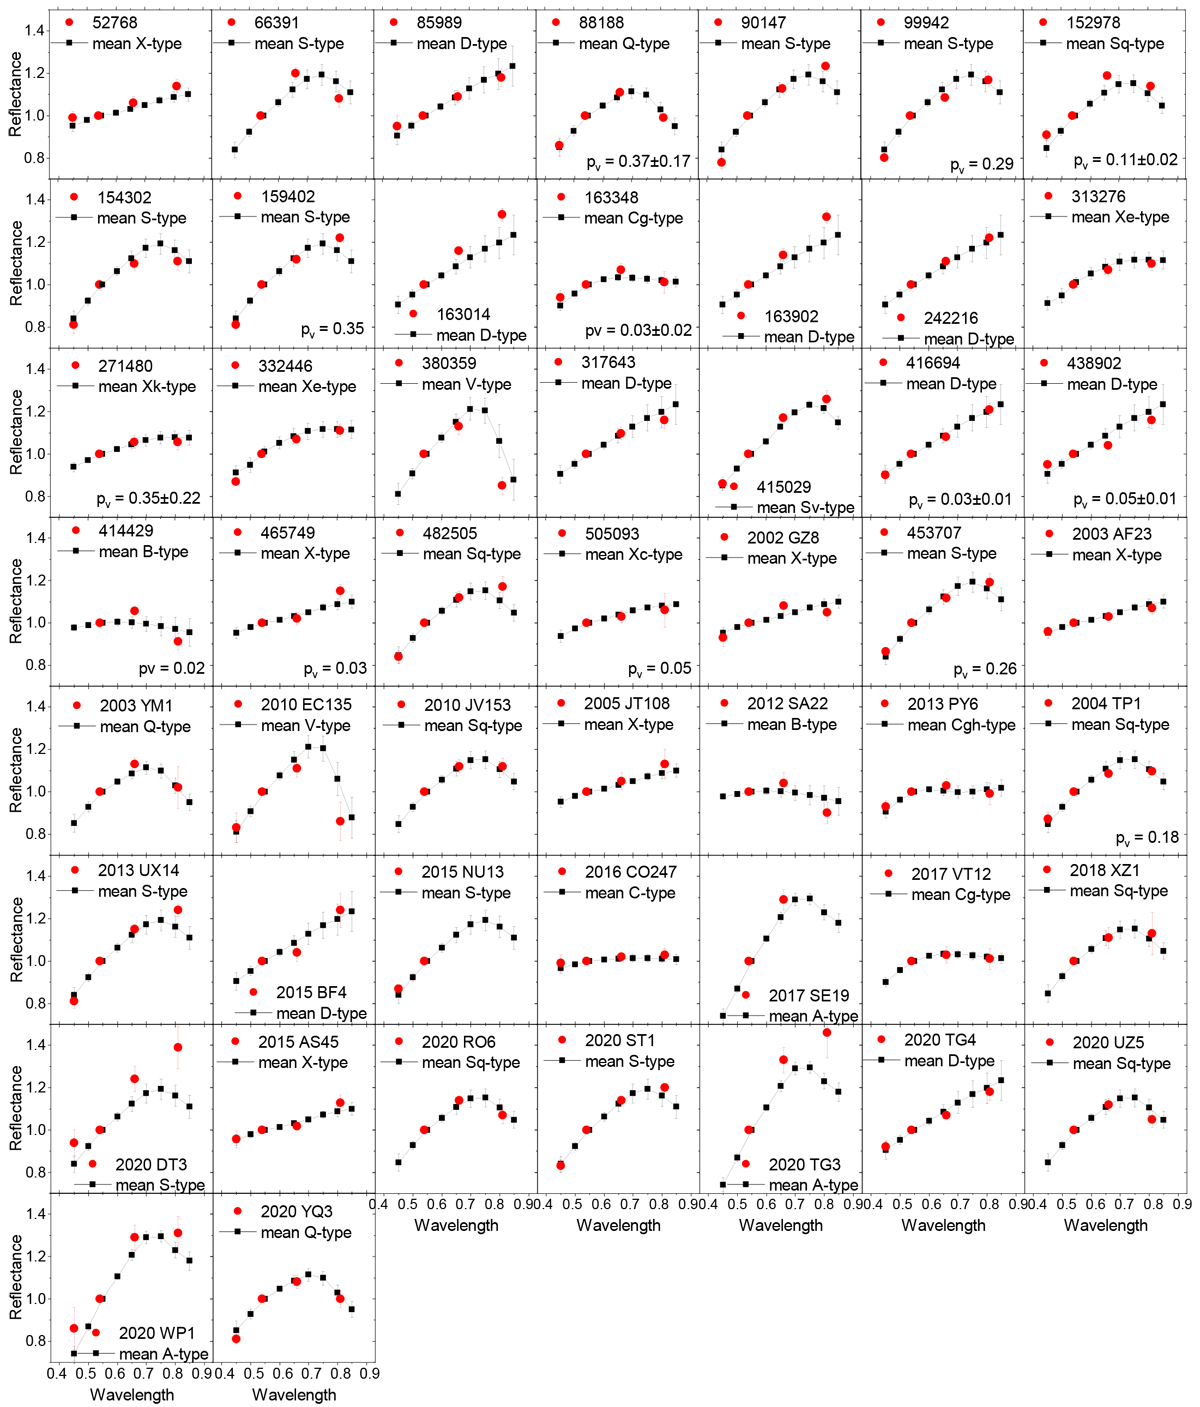
Individual reflectance spectra of the observed NEOs (red dots) together with the mean spectra of the most likely taxonomic class from DeMeo et al. (2009) (black squares). The spectra are normalized at 0.54 μm. When available, the albedo values and corresponding errors are shown in the plots.
Current usage metrics show cumulative count of Article Views (full-text article views including HTML views, PDF and ePub downloads, according to the available data) and Abstracts Views on Vision4Press platform.
Data correspond to usage on the plateform after 2015. The current usage metrics is available 48-96 hours after online publication and is updated daily on week days.
Initial download of the metrics may take a while.