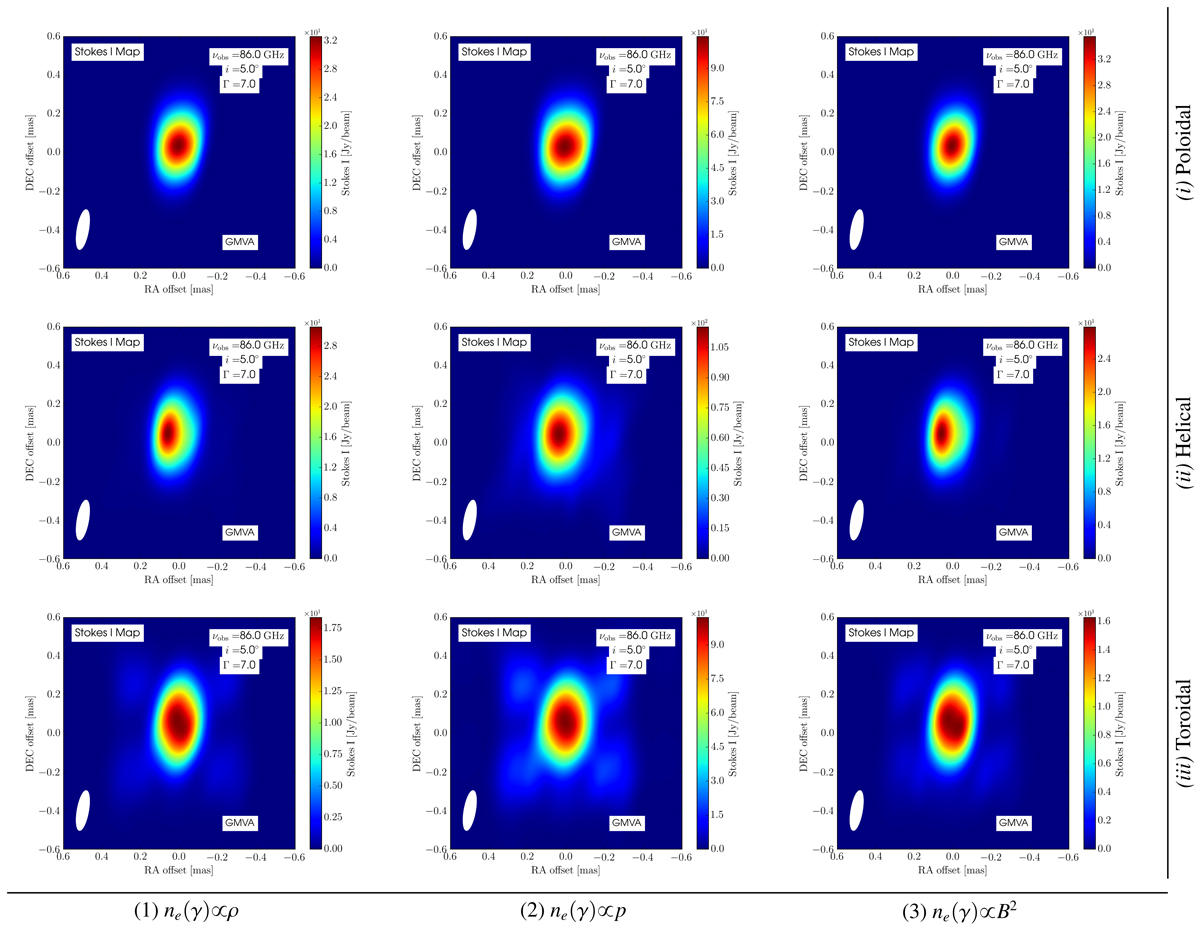
Fig. 8.
Download original image
Ray-tracing images of our jets in total intensity when each jet is viewed edge-on. The images highlight similar epochs in the jet’s evolution during each 3D RMHD simulation at 86 GHz. From left to right: proportionality of the NTEs to the fluid’s density, internal energy density, and magnetic energy density. From top to bottom: purely poloidal magnetic field, helical magnetic field, and purely toroidal magnetic field. The ray-traced images are convolved with a Gaussian beam indicative of the resolution of the GMVA and with a Gaussian noise floor of 10−4 Jy beam−1.
Current usage metrics show cumulative count of Article Views (full-text article views including HTML views, PDF and ePub downloads, according to the available data) and Abstracts Views on Vision4Press platform.
Data correspond to usage on the plateform after 2015. The current usage metrics is available 48-96 hours after online publication and is updated daily on week days.
Initial download of the metrics may take a while.