Fig. 2.
Download original image
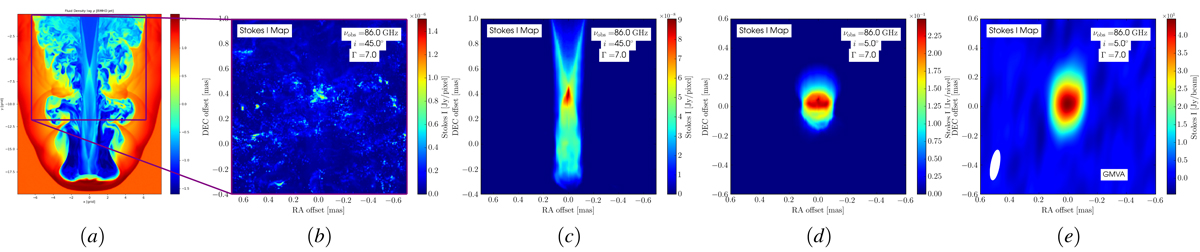
From left to right: a demonstration of our synthetic imaging pipeline: Panel a: starts with a 2D cut through our 3D RMHD jet colored by thermal density. Panels b–e: zoomed into an unobscured region of the jet’s standing shock (demarcated with a purple box in panel a) and show: (b) the ray-traced synchrotron emission without the use of a jet tracer; (c) the ray-traced synchrotron emission with the use of a jet tracer to exclude the ambient medium; (d) the same simulation epoch but rotated to a viewing angle of i = 5°; and (e) the ray-traced image convolved with a Gaussian beam indicative of the resolution of the GMVA and with a Gaussian noise floor (to mimic array sensitivity) of 10−1 Jy beam−1.
Current usage metrics show cumulative count of Article Views (full-text article views including HTML views, PDF and ePub downloads, according to the available data) and Abstracts Views on Vision4Press platform.
Data correspond to usage on the plateform after 2015. The current usage metrics is available 48-96 hours after online publication and is updated daily on week days.
Initial download of the metrics may take a while.