Fig. 8.
Download original image
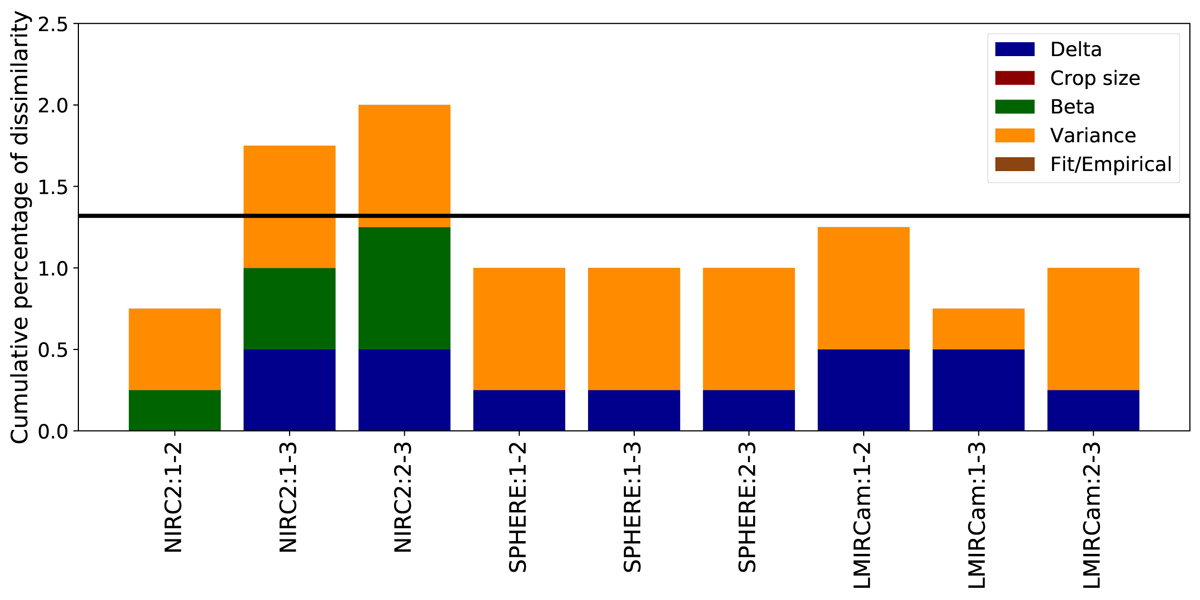
Percentage of dissimilarity between RSM parameter sets for nine pairs of ADI sequences. The different coloured bars provide the contribution of the different parameters to the cumulative dissimilarity. The selected pairs of ADI sequences are generated by the same instrument. The black horizontal line represents the percentage of dissimilarity averaged over the 36 possible pairs of ADI sequences.
Current usage metrics show cumulative count of Article Views (full-text article views including HTML views, PDF and ePub downloads, according to the available data) and Abstracts Views on Vision4Press platform.
Data correspond to usage on the plateform after 2015. The current usage metrics is available 48-96 hours after online publication and is updated daily on week days.
Initial download of the metrics may take a while.