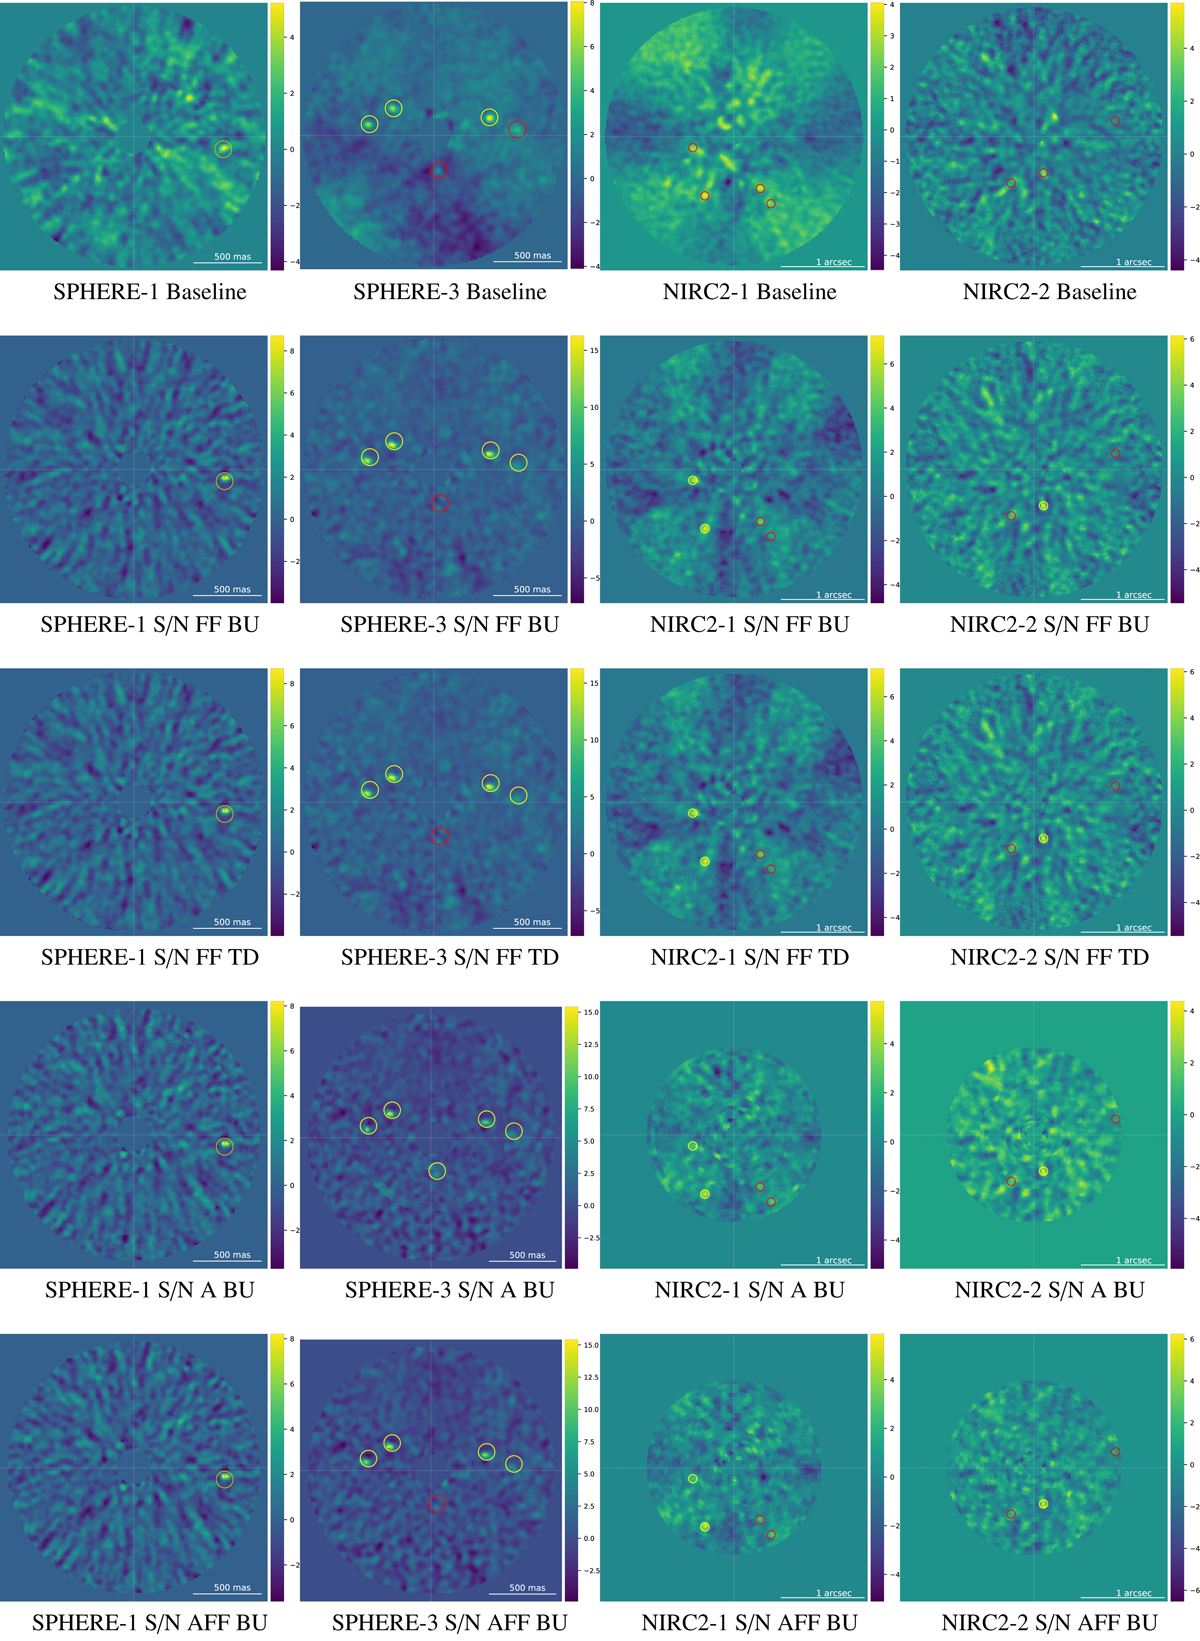
Fig. D.1.
Download original image
Detection maps corresponding to the SPHERE and NIRC2 data sets generated with different parametrisations of the full-frame and annular auto-S/N along the baseline model presented in (Cantalloube et al. 2020). The SPHERE-2 and NIRC2-3 detection maps are not shown, as no fake companions were injected in these two data sets. See Sect. 4.3.1 for the definition of the acronyms used to characterise the auto-RSM versions. The yellow circles are centred on the true position of the detected targets (TP) and the red circles give the true positions of FNs.
Current usage metrics show cumulative count of Article Views (full-text article views including HTML views, PDF and ePub downloads, according to the available data) and Abstracts Views on Vision4Press platform.
Data correspond to usage on the plateform after 2015. The current usage metrics is available 48-96 hours after online publication and is updated daily on week days.
Initial download of the metrics may take a while.