Fig. 5

Download original image
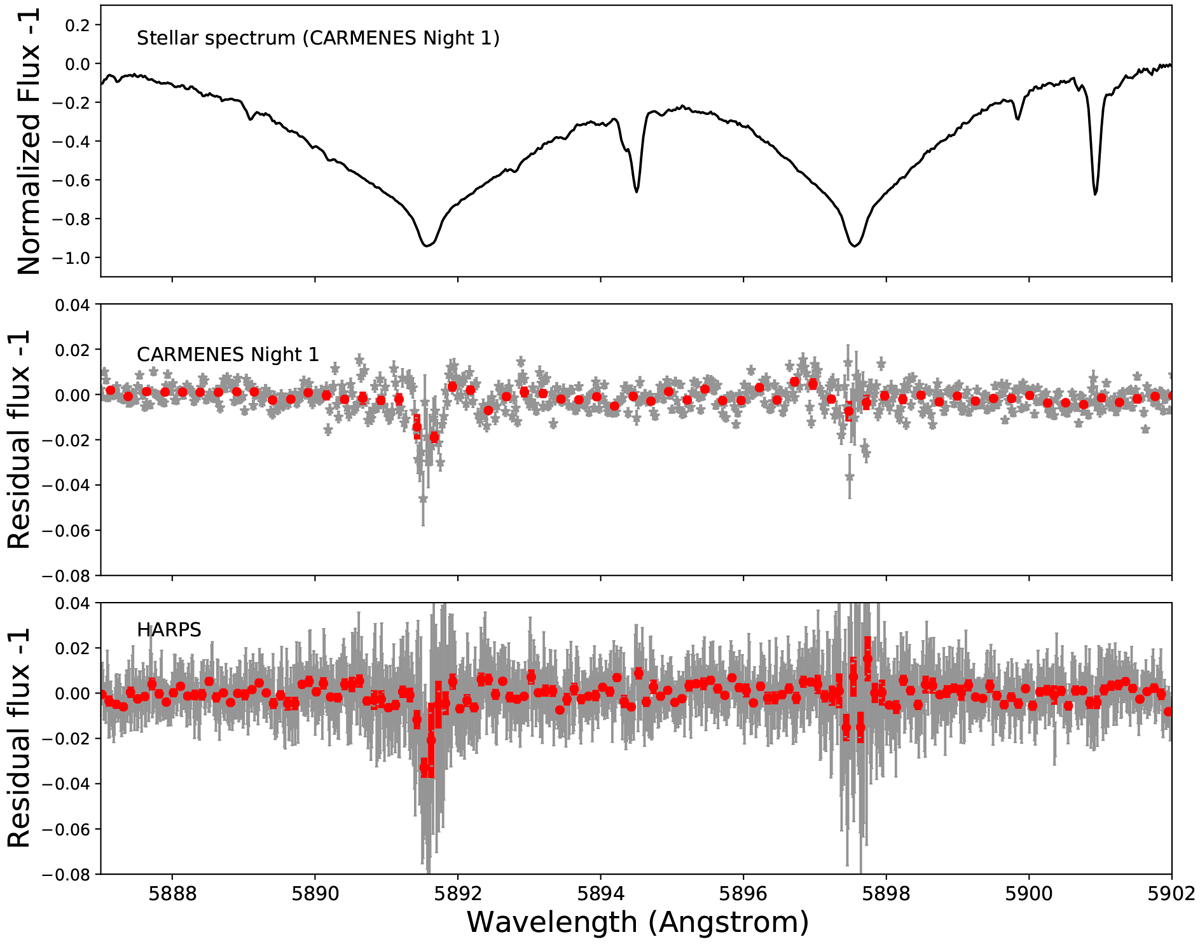
Top panel: stellar spectrum (telluric absorption corrected) of WASP-69 around the Na I doublet. Middle panel: planet transmission spectrum of WASP-69 b in the same wavelength range. The gray data points show the division of in-transit by out-of-transit data, corrected for the changing orbital velocity of the planet. The red filled circles are the data binned by 0.25 Å and the red error bars are the standard deviation of each group of binned data points. Bottom panel: planet transmission spectrum obtained with HARPS-N by Casasayas-Barris et al. (2017), shown for comparison. Both CARMENES and HARPS-N data show a similar pattern.
Current usage metrics show cumulative count of Article Views (full-text article views including HTML views, PDF and ePub downloads, according to the available data) and Abstracts Views on Vision4Press platform.
Data correspond to usage on the plateform after 2015. The current usage metrics is available 48-96 hours after online publication and is updated daily on week days.
Initial download of the metrics may take a while.


