Fig. 12

Download original image
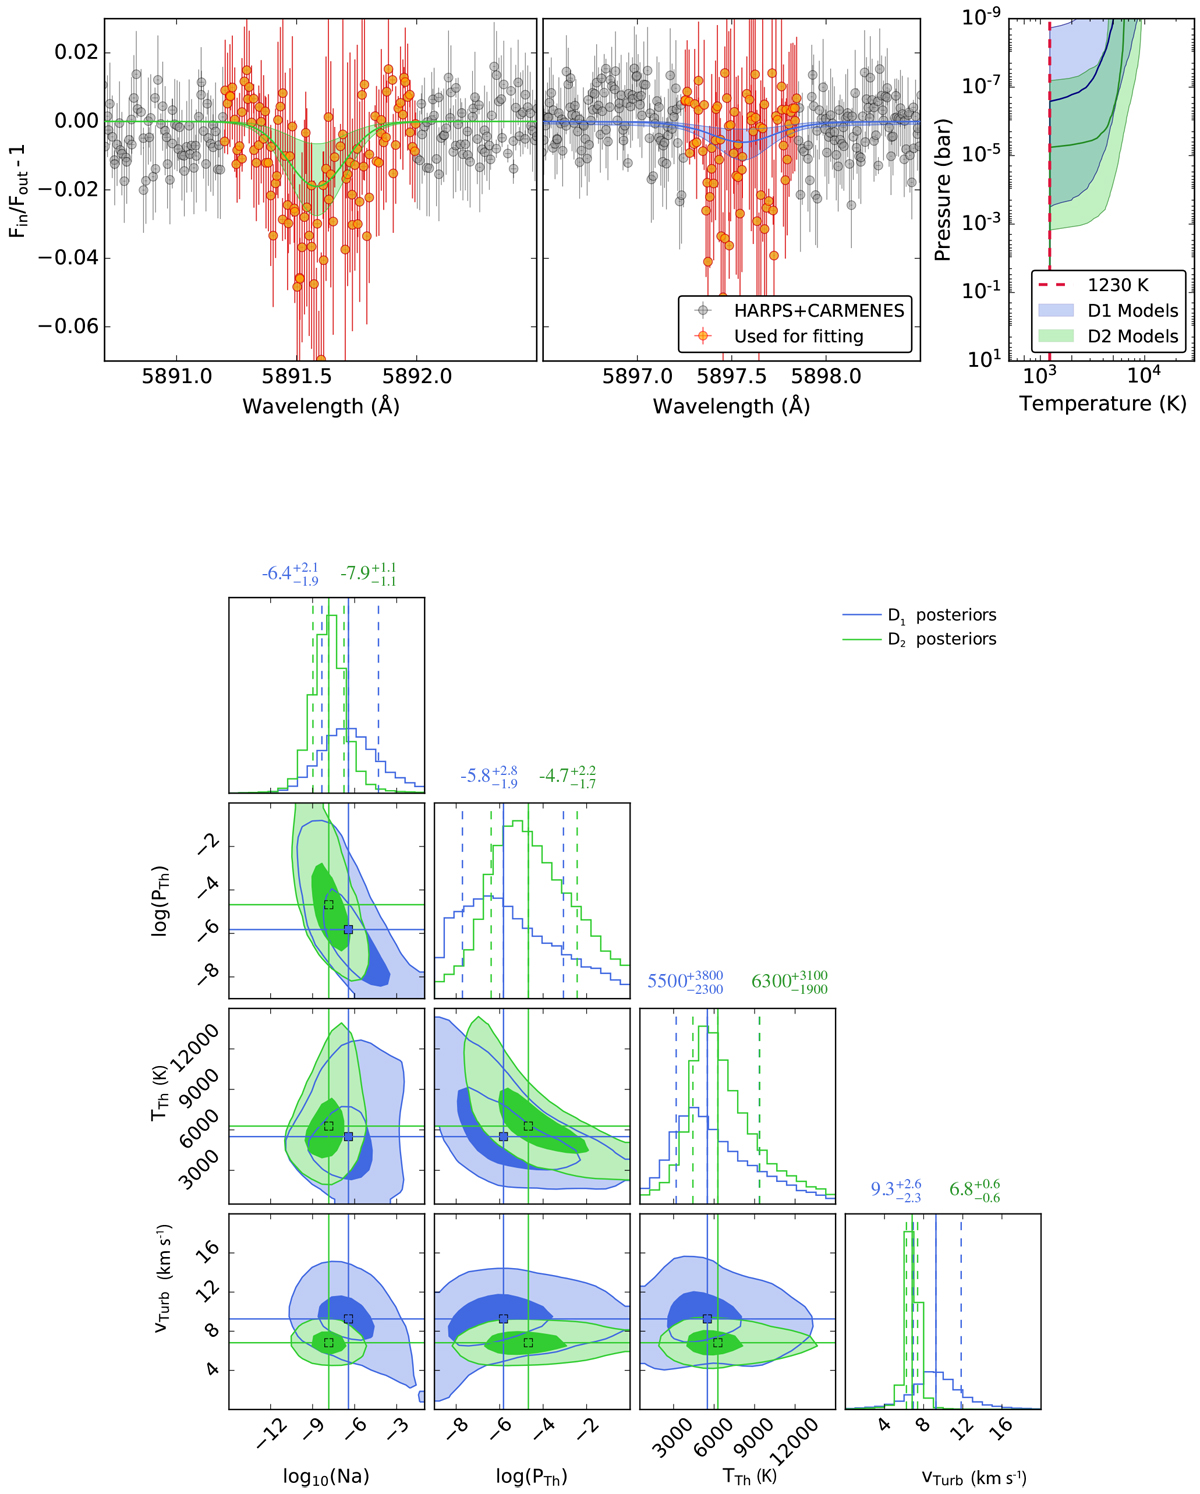
Top: bayesian inference of the upper thermospheric conditions of WASP-69 b. Comparison of the best-fit model spectra of Na I D2 (left panel, shaded green area) and Na I D1 (middle panel, shaded blue area) with discarded and used high-resolution spectroscopic data in gray and orange, respectively, and retrieved temperature profiles based on the posteriors (right panel). The dashed vertical line in red marks the retrieved temperature using low-resolution spectra (Sect. 4.1). Uncertainties are marked by vertical dashed lines at the 16, 50, and 84% quantiles. Bottom: posterior probability distributionof high-resolution model parameters as well as the marginalized distribution for each parameter for Na D2 (shaded green area) and D1 (shaded blue area) in WASP-69 b. The marginalized uncertainties are marked by vertical dashed lines at the 16%, 50%, and 8 4% quantiles. In the density maps, 1σ and 2σ are given as 1 − e−0.5 ~ 0.393 and 1 −e−2.0 ~ 0.865, respectively,as is common for multivariate MCMC results.
Current usage metrics show cumulative count of Article Views (full-text article views including HTML views, PDF and ePub downloads, according to the available data) and Abstracts Views on Vision4Press platform.
Data correspond to usage on the plateform after 2015. The current usage metrics is available 48-96 hours after online publication and is updated daily on week days.
Initial download of the metrics may take a while.


