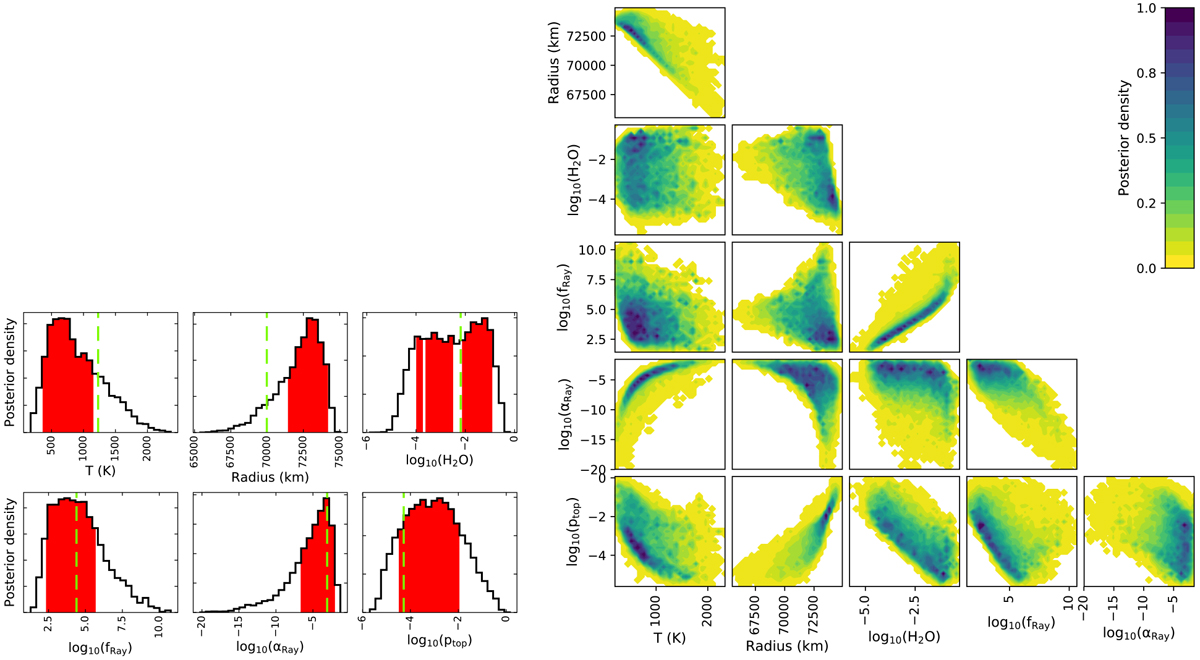
Fig. 10

Download original image
Left: marginal posterior distributions (histograms) when the WFC3 and O1 data are included. The shaded red areas denotethe 68% confidence intervals of the respective distributions. The light green dashed vertical lines denote the retrieved best-fit parameter values. Strong non-linear correlations seen in the right panel of this figure produce that some of the best-fit parameter values fall outside of the red credible regions, and cause gaps in the water confidence interval, reflecting a bi-modal posterior distribution. Right: pair-wise correlation plots with posterior densities.
Current usage metrics show cumulative count of Article Views (full-text article views including HTML views, PDF and ePub downloads, according to the available data) and Abstracts Views on Vision4Press platform.
Data correspond to usage on the plateform after 2015. The current usage metrics is available 48-96 hours after online publication and is updated daily on week days.
Initial download of the metrics may take a while.


