Fig. 9.
Download original image
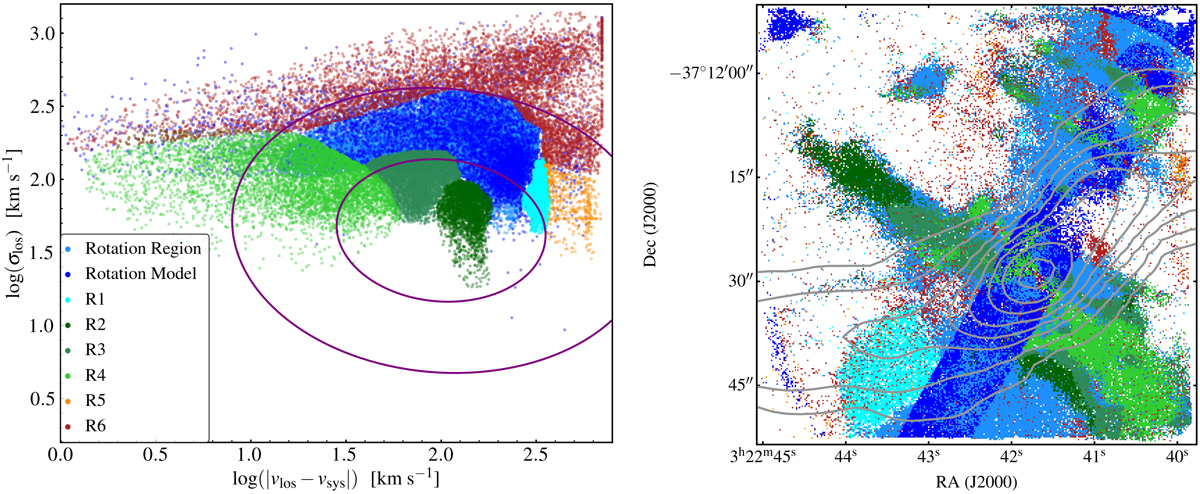
Left panel: velocity dispersion versus line shift (k-plot) with respect to the systemic velocity of the [N II]λ6583 line emission in logarithmic scale. Colours identify different regions in the plot. Pixels consistent with the model of rotation are shown in blue, while pixels in the kinematical region of rotation are shown in light blue. The purple ellipses show the 1, 2σ confidence intervals tied to the global log-normal distributions found for chaotic cold accretions (Gaspari et al. 2018). Right panel: distribution of the ionised gas. Colours correspond to the plot in the left panel. Radio jets are shown by black contours.
Current usage metrics show cumulative count of Article Views (full-text article views including HTML views, PDF and ePub downloads, according to the available data) and Abstracts Views on Vision4Press platform.
Data correspond to usage on the plateform after 2015. The current usage metrics is available 48-96 hours after online publication and is updated daily on week days.
Initial download of the metrics may take a while.