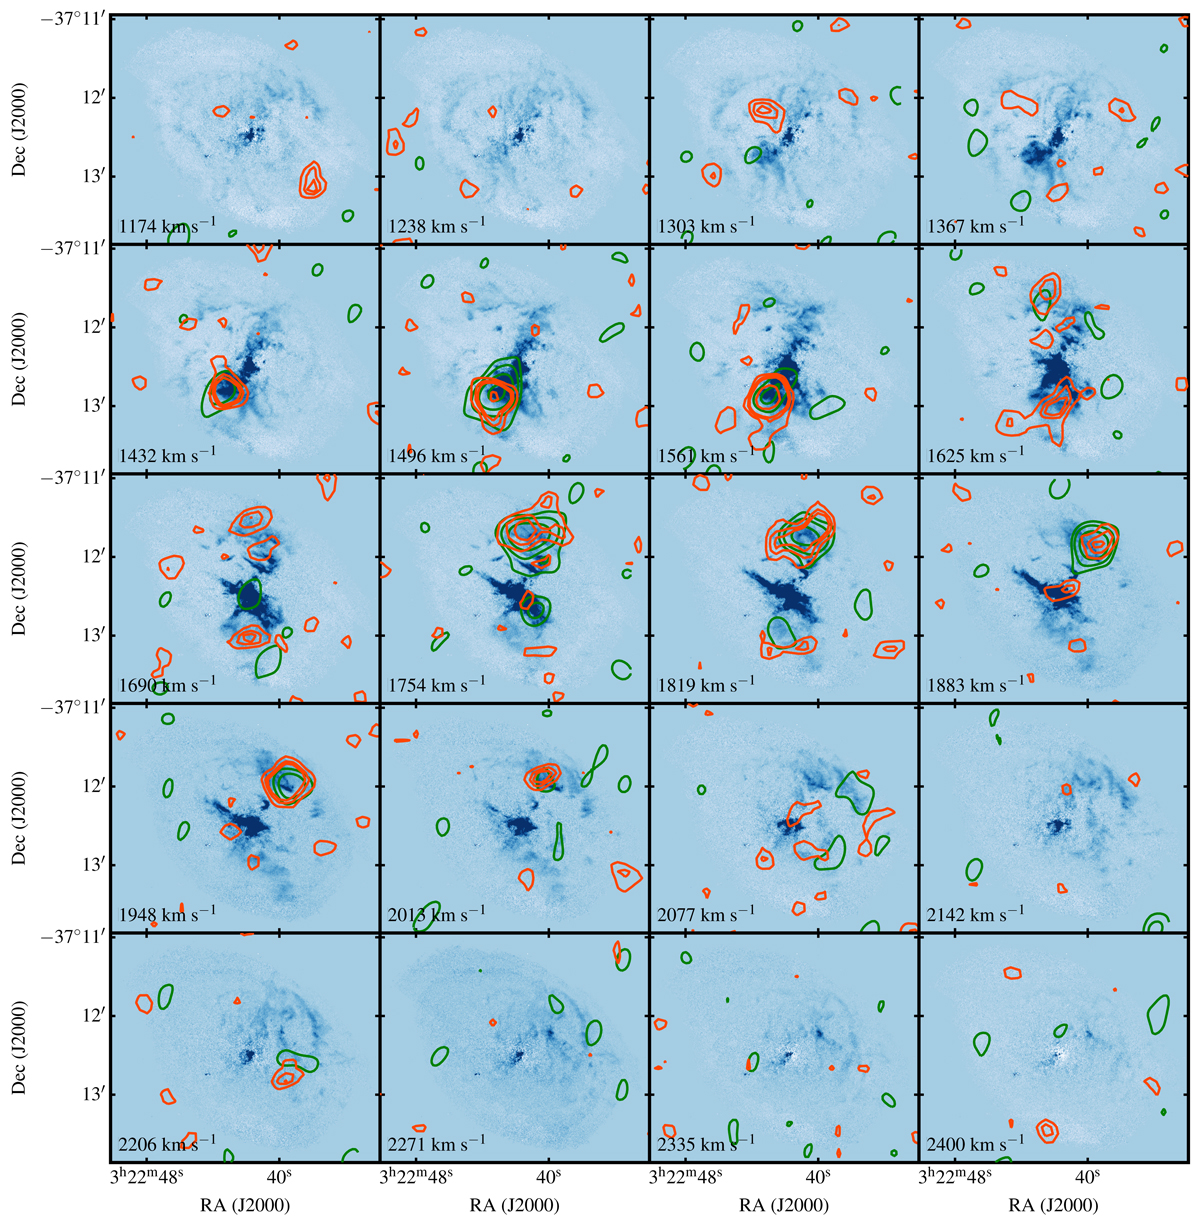
Fig. 7.
Download original image
Consecutive channel maps of the [N II]λ6583 line extracted from the MUSE wide-field datacube in the velocity range 1174 − 2400 km s−1 (the systemic velocity of Fornax A is 1720 km s−1). The contours of the CO emission (0.03, 0.06, 0.12, 0.15, 0.2 Jy beam−1) and of the H I gas (0.15, 0.3, 0.6, 1.2 mJy beam−1) are shown in green and orange, respectively.
Current usage metrics show cumulative count of Article Views (full-text article views including HTML views, PDF and ePub downloads, according to the available data) and Abstracts Views on Vision4Press platform.
Data correspond to usage on the plateform after 2015. The current usage metrics is available 48-96 hours after online publication and is updated daily on week days.
Initial download of the metrics may take a while.