Fig. 6.
Download original image
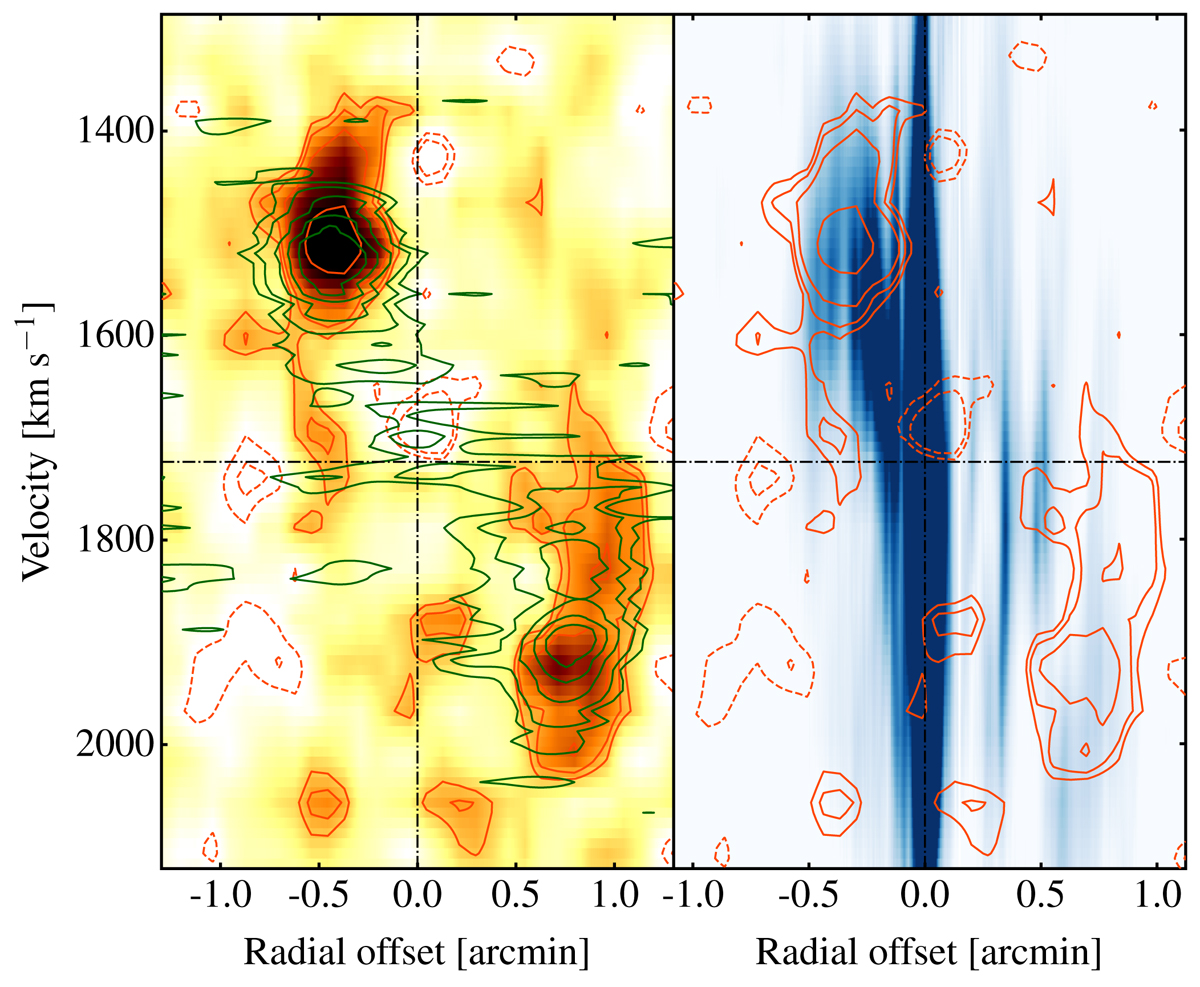
Position-velocity diagrams along the major axis of the inner nearly edge-on disk. Left panel: Pv-diagram of the atomic and molecular gas (green contours). H I emission is shown by the colour scale and orange solid contours, while absorption is represented by dashed contours. Contour levels are −5; −3; 3, 5, 6, 12, 24σ. Right panel: Pv-diagram derived from the [N II]λ6583 emission (blue colour scale) overlaid with the H I emission and absorption.
Current usage metrics show cumulative count of Article Views (full-text article views including HTML views, PDF and ePub downloads, according to the available data) and Abstracts Views on Vision4Press platform.
Data correspond to usage on the plateform after 2015. The current usage metrics is available 48-96 hours after online publication and is updated daily on week days.
Initial download of the metrics may take a while.